
Quadratic Equations and Roots: Dynamic Visualization by Chris Luke
Loading the math board and drawing, please wait…
In collections
Binomial distribution and the Premier League season
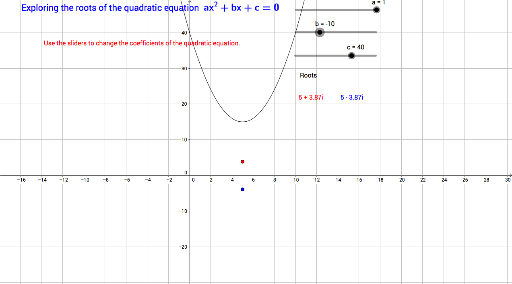
① This GeoGebra example dynamically demonstrates how the roots of a quadratic equation ax²+bx+c=0 (i.e., the x-intercepts of the parabola) change as the coefficients a, b, and c vary. ② Core mathematical concepts include quadratic functions, the discriminant, Vieta's formulas (sum and product of roots), and the parabola's opening direction and vertex position. ③ Construction highlights: sliders control coefficients a, b, c; the parabola object is defined; the discriminant and roots r, t are computed; text objects text1 through text8 display the equation, discriminant, and root values in real time; auxiliary objects such as e, ac, f, g, h, s, u, P, Q, N, M are used for marking intersection points or auxiliary lines. ④ Suitable for middle school to high school students learning quadratic equations and function graphs, as well as for teachers' classroom demonstrations to visually explore how coefficient changes affect roots and the geometric meaning of the discriminant.
GeoGebra Commands & Parameters
Numeric a(1)Numeric b(-10)Numeric c(40)y = (a * x^(2)) + (b * x) + c(-(b / ((2 * a))))(a * c)b^(2) - (4 * ac)(-f)f > 0e + (h * sqrt(abs(f)) / ((2 * a)))e - (h * sqrt(abs(f)) / ((2 * a)))((1 - h) * sqrt(abs(f)) / ((2 * a)))(-s)(r, s)(t, s)(t, (-s))(r, s)
AI Drawing Prompt Reference
Create a dynamic quadratic function graph with sliders controlling coefficients a, b, and c, initially set to 1, -10, and 40. Display the parabola y = ax² + bx + c, and mark its x-intercepts (the roots). Show the discriminant Δ = b² - 4ac, and indicate whether roots are real and distinct, equal, or non-real. When Δ > 0, plot two distinct root points; when Δ = 0, show a single tangent point; when Δ < 0, no real roots. Also display the vertex and axis of symmetry. Use text labels to update the equation, discriminant, and root values in real time. Include coordinate axes, grid, and auxiliary points for intersections or construction lines.
The prompt above was compiled from the original drawing commands and is for reference only.