
Quadratic Equation
Loading the math board and drawing, please wait…
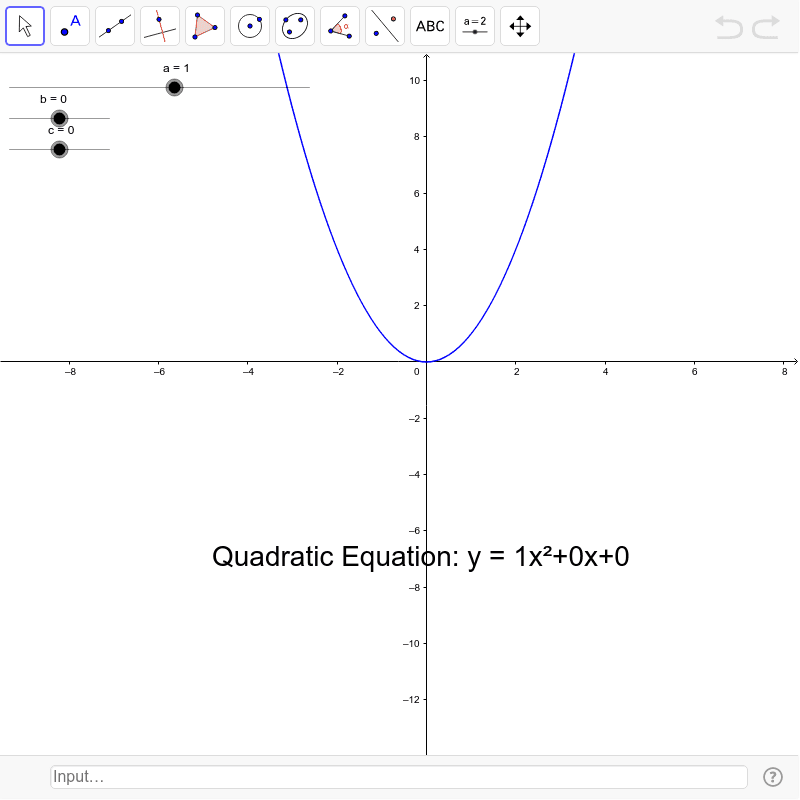
This example demonstrates the graph of a quadratic equation. It involves the core mathematical concept of quadratic functions. By adjusting coefficients a, b, and c, you can observe changes in the quadratic function's graph. The construction summary mentions the use of objects a, b, c, d, and text1. Suitable for high school mathematics education and learning about quadratic function graph transformations.
GeoGebra Commands & Parameters
Numeric a(1.0)Numeric b(0.0)Numeric c(0.0)y = (a * x^(2)) + (b * x) + c
AI Drawing Prompt Reference
Draw the graph of a quadratic function by adjusting coefficients a, b, and c. Start by setting a to 1, and b and c to 0, then plot the function y = ax^2 + bx + c.
The prompt above was compiled from the original drawing commands and is for reference only.