
Pythagorean Theorem Visualization
Loading the math board and drawing, please wait…
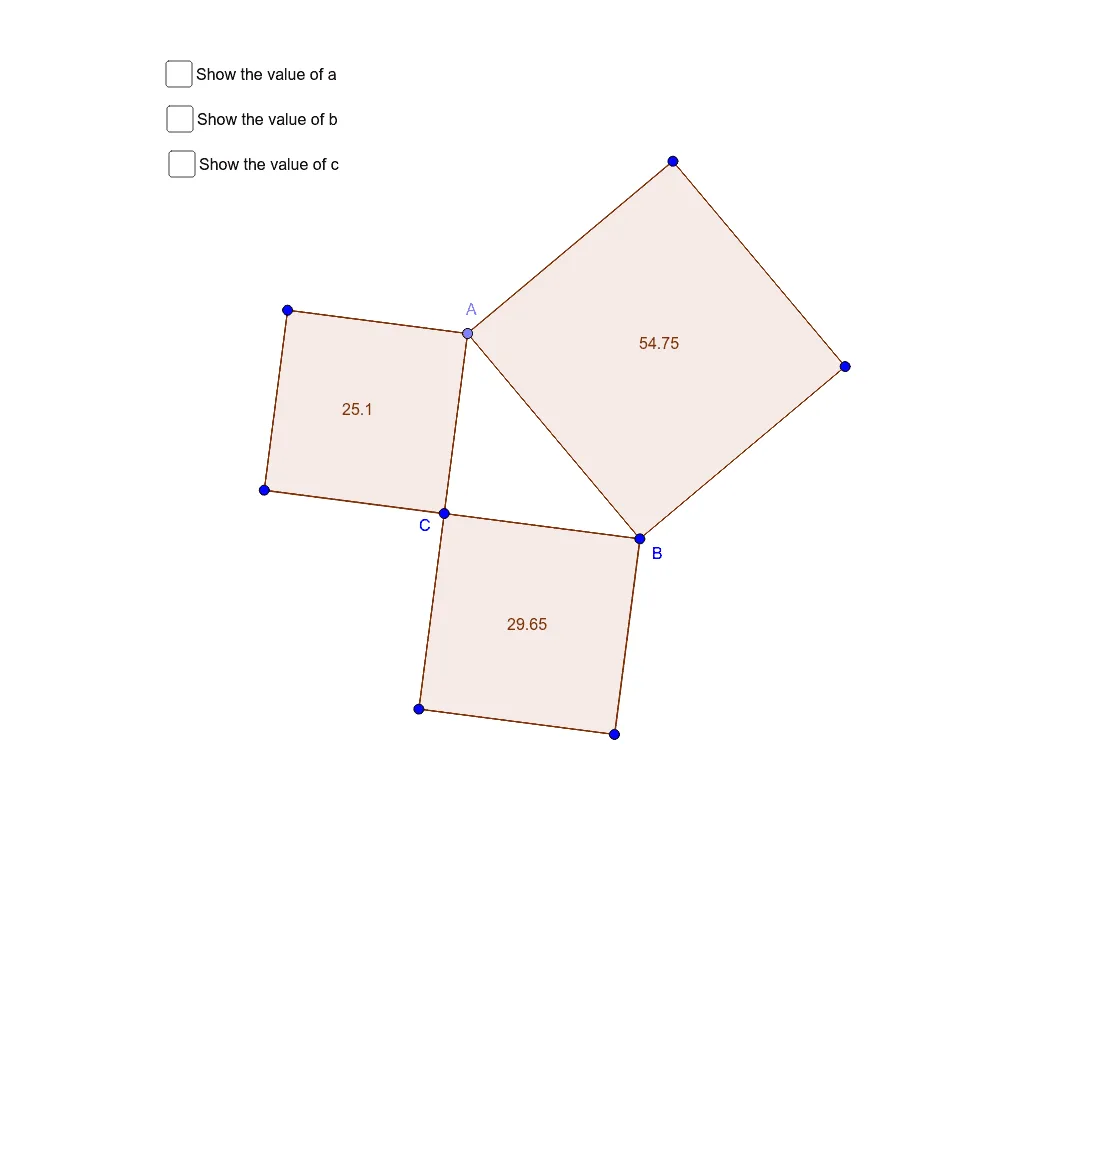
This example visually demonstrates the Pythagorean Theorem by constructing squares on the sides of a right triangle. The theorem states that in a right triangle, the square of the length of the hypotenuse (the side opposite the right angle) is equal to the sum of the squares of the lengths of the other two sides. Using GeoGebra commands such as Ray, OrthogonalLine, Point, Segment, and Squaretool, the example dynamically shows the relationship between the areas of the squares on the sides of a right triangle. Suitable for students in middle school and above to learn geometry and algebra.
GeoGebra Commands & Parameters
Ray(C, B) → a_1OrthogonalLine(C, a_1) → b_1Point(b_1) → ASegment(A, B) → cSegment(B, C) → aSegment(C, A) → bSquaretool(C, A) → poly1, d, E, e, f, g, h, i, j, k, DSquaretool(B, C) → poly2, l, G, m, n, p, q, r, s, t, FSquaretool(A, B) → poly3, c_1, I, d_1, e_1, f_1, g_1, h_1, i_1, j_1, H