
Pure Quadratic Inequalities Demo
Loading the math board and drawing, please wait…
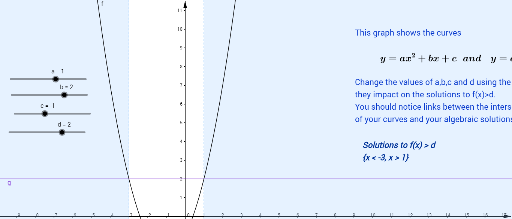
This example demonstrates the solution set of quadratic inequalities in the coordinate system. It involves core mathematical concepts such as quadratic functions, inequality solution sets, and function graph transformations. Construction highlights include using GeoGebra commands/objects like b, c, d, g, list1, a, f, e, list2, text1, text2, text3 for defining parameters, plotting function graphs, and displaying inequality solution sets. Suitable for high school mathematics teaching to understand the geometric meaning and solution methods of quadratic inequalities.
GeoGebra Commands & Parameters
Numeric b(2)Numeric c(-1)Numeric d(2)g(x) = d{}Numeric a(1)f(x) = (a * x^(2)) + (b * x) + ce(x) = f(x) > g(x)List list2
AI Drawing Prompt Reference
In a coordinate system, draw an upward-opening parabola with quadratic coefficient 1, linear coefficient 2, and constant term -1. Also draw a horizontal line at y=2. Shade or highlight the region where the parabola lies above this line (i.e., where the function value is greater than 2), representing the solution set of the quadratic inequality. Add text labels indicating the intersection points and the interval of the solution set.
The prompt above was compiled from the original drawing commands and is for reference only.