
FSMQ: Estimating area under curve by rectangles
Loading the math board and drawing, please wait…
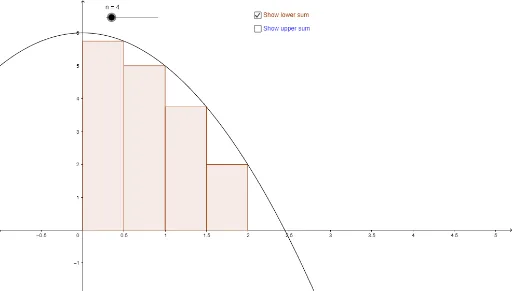
This example demonstrates how to approximate the area under a curve using rectangles. The key mathematical concepts include integral ideas, rectangle area calculation, and function graph analysis. Construction involves using GeoGebra commands LowerSum and UpperSum to create lower and upper sums. Suitable for high school students learning calculus fundamentals or university mathematics courses as a supplementary tool.
GeoGebra Commands & Parameters
LowerSum(f, a, b, n) → LowSumUpperSum(f, a, b, n) → UpSum
AI Drawing Prompt Reference
Draw a smooth function curve and approximate the area beneath it using rectangles over a specified interval. Include two sets of rectangles: one set lying below or touching the curve to represent the lower sum, and another set rising above or touching the curve to represent the upper sum. The rectangles should have equal width and span the entire interval, visually demonstrating how rectangular areas estimate the integral. This diagram is suitable for calculus instruction.
The prompt above was compiled from the original drawing commands and is for reference only.