
Proportion Confidence Interval
Loading the math board and drawing, please wait…
In collections
Statistics Demonstrations
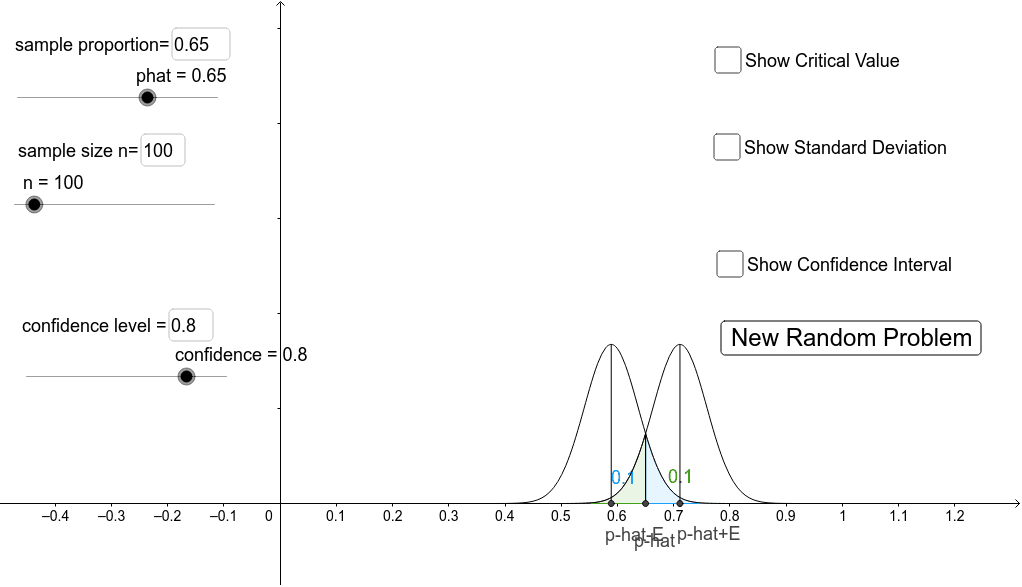
This example demonstrates how to compute the confidence interval for a proportion. It involves key concepts in probability and statistics. Using GeoGebra commands such as Segment, Integral, and Textfield, the process of calculating the confidence interval is visually illustrated. Suitable for high school and above students or teachers.
GeoGebra Commands & Parameters
Segment(A, B) → aIntegral(f, phat, phat + (3 * E)) → bIntegral(g, phat - (3 * E), phat) → cSegment(C, D) → dSegment(F, G) → eTextfield(confidence) → inputBox1Textfield(n) → inputBox2Textfield(phat) → inputBox3
AI Drawing Prompt Reference
Draw a diagram showing the confidence interval for a proportion, including a horizontal segment representing the proportion range, two integral areas indicating the upper and lower parts of the confidence interval, and connect key points with line segments, while adding text boxes for inputting the confidence level, sample size, and sample proportion to visually illustrate the calculation process.
The prompt above was compiled from the original drawing commands and is for reference only.