
Properties of Rectangles on a Coordinate Grid
Loading the math board and drawing, please wait…
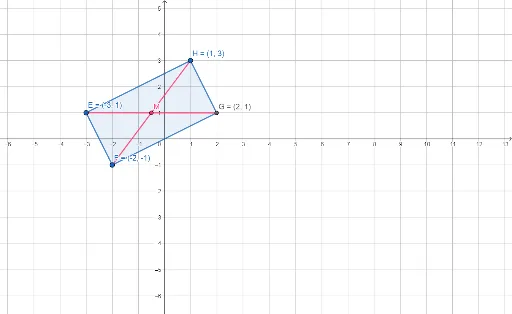
This example demonstrates how to draw rectangles on a coordinate grid and explore their properties. Key math concepts involved include perimeter, angles, percentages, and fractal geometry. Construction highlights the use of GeoGebra commands and objects such as Line, OrthogonalLine, Point, Intersect, Polygon, and Segment. Suitable for middle school and above students to learn geometric constructions and property analysis in analytical geometry.
GeoGebra Commands & Parameters
Line(E, F) → fOrthogonalLine(E, f) → hOrthogonalLine(F, f) → iPoint(h) → HLine(H, f) → gIntersect(i, g) → GPolygon(E, F, G, H) → q1, a, b, d, cSegment(E, G) → jSegment(H, F) → kIntersect(j, k) → M
AI Drawing Prompt Reference
Draw a rectangle on a coordinate grid by first creating a line segment EF, then drawing perpendicular lines from points E and F to meet at points H and G respectively. Connect H and G, and E and F to form the rectangle. Then, draw line segments EG and HF, and find their intersection point M. This results in a rectangle with its diagonals and their intersection point.
The prompt above was compiled from the original drawing commands and is for reference only.