
Profit and Loss Calculator via Percent Modeling
Loading the math board and drawing, please wait…
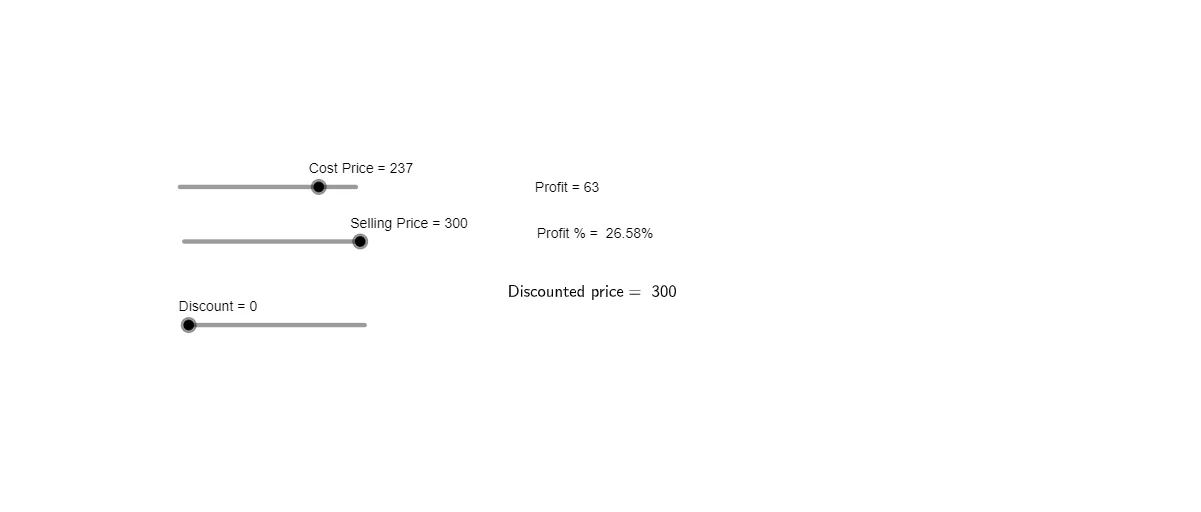
This GeoGebra example demonstrates the phenomenon of profit and loss as a percent change from a base value: given an initial amount and a percentage, it visually links the updated value, the difference (gain or loss), and labeled intermediate quantities. The core math ideas are percentages (growth/decay factors), linear relationships between the base and the new amount, and conditional logic to switch between profit and loss cases. Construction relies on the provided commands and objects: an If command drives the case distinction (using cp, sp as parameterized values for different branches; d and dp as the corresponding differences/derived quantities); text1, text2, and text3 are used to present computed results clearly; and objects like l and pp support the geometric/graphical layout that makes the calculation interpretable. Suitable for middle and high school learning, especially for lessons on percent applications, parameterized modeling, and interactive visualization of calculator-style computations.
GeoGebra Commands & Parameters
If(cp < sp, dp - cp, cp - dp) → l
AI Drawing Prompt Reference
Create a graph showing percentage changes in profit and loss. The initial amount is 100, and the percentage change is 50%. Use a conditional statement to calculate and display the profit or loss. The graph should include a text box showing the final amount, a text box showing the difference, and a line segment representing the relationship between the initial and changed amounts.
The prompt above was compiled from the original drawing commands and is for reference only.