
Demonstrating Line Slope via Orthogonal Lines and Angles
Loading the math board and drawing, please wait…
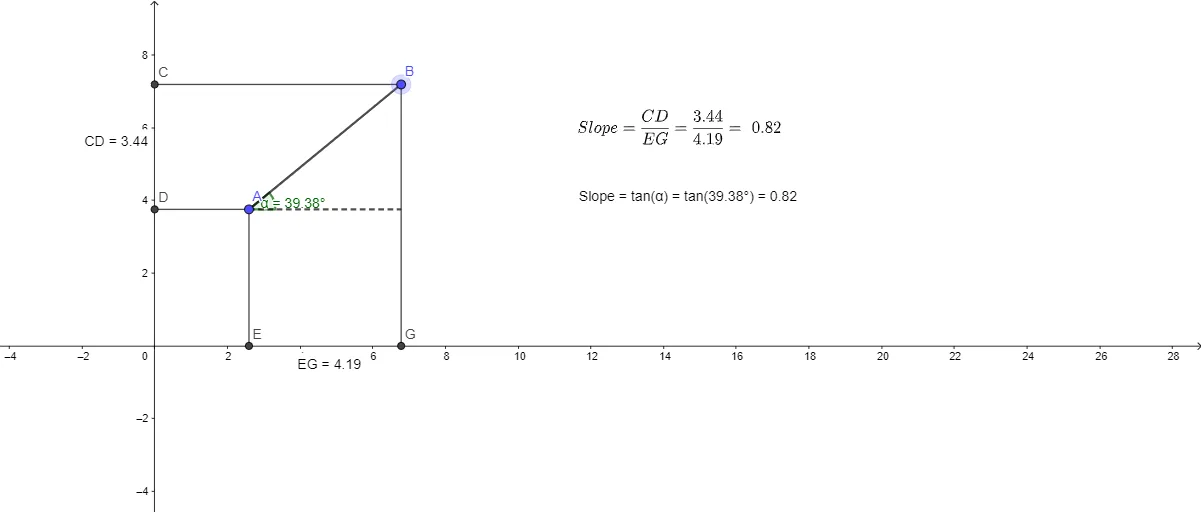
This example visualizes the concept of a line’s slope by constructing an orthogonal helper line, finding intersections, and measuring distances and angles that encode the slope geometrically. The main ideas include slope (as a directional measure), angle measurement, orthogonality, and using geometric measurements to link direction/tilt to quantitative values. Construction highlights: it uses Segment to form the reference line/segments through key points (e.g., A, B); OrthogonalLine to build a perpendicular line at the appropriate location; Intersect to determine crucial intersection points (related to objects such as C, D, E, G, etc.); Distance to compute relevant lengths (e.g., distanceEG and distanceCD); and Text objects (TextEG, TextCD, text1, text2) to display these measurements. Finally, Angle is used to obtain the angle α (and related angle information), establishing the geometric foundation for interpreting slope. Suitable for middle and high school learners, and for interactive lessons connecting geometry to function/graphing intuition.
GeoGebra Commands & Parameters
Segment(A, B) → fOrthogonalLine(A, g) → hOrthogonalLine(B, g) → iOrthogonalLine(A, j) → kOrthogonalLine(B, j) → lIntersect(l, j) → CIntersect(k, j) → DIntersect(g, xAxis) → FOrthogonalLine(A, xAxis) → mOrthogonalLine(B, xAxis) → nIntersect(m, xAxis) → EIntersect(g, n) → GSegment(B, G) → pSegment(A, E) → qSegment(B, C) → rSegment(A, D) → sDistance(E, G) → distanceEGDistance(C, D) → distanceCDIntersect(k, n) → HAngle(H, A, B) → αSegment(A, H) → t
AI Drawing Prompt Reference
On a coordinate plane, start with two given points and draw the reference line segment between them to represent the slope direction. Through one endpoint, construct a perpendicular helper line to the reference line; through the other endpoint, construct the corresponding perpendicular helper line in the same way. Build a second pair of perpendicular helper lines from each endpoint with respect to another chosen auxiliary direction so that their intersections with each other and with the first helpers create several key intersection points. Find where the chosen auxiliary line meets the horizontal axis to obtain two points, then draw the connecting segments that encode the geometric meaning of the slope. Measure the distances between the horizontal-axis intersection point pairs and between the relevant intersection points, and at the appropriate intersection point measure the angle formed by the segments to the two original endpoints. Finish by drawing one extra segment from the angle point to emphasize the relationship between direction and the measured angle.
The prompt above was compiled from the original drawing commands and is for reference only.