
Interactive Linear Programming: Optimization with Multiple Constraints
Loading the math board and drawing, please wait…
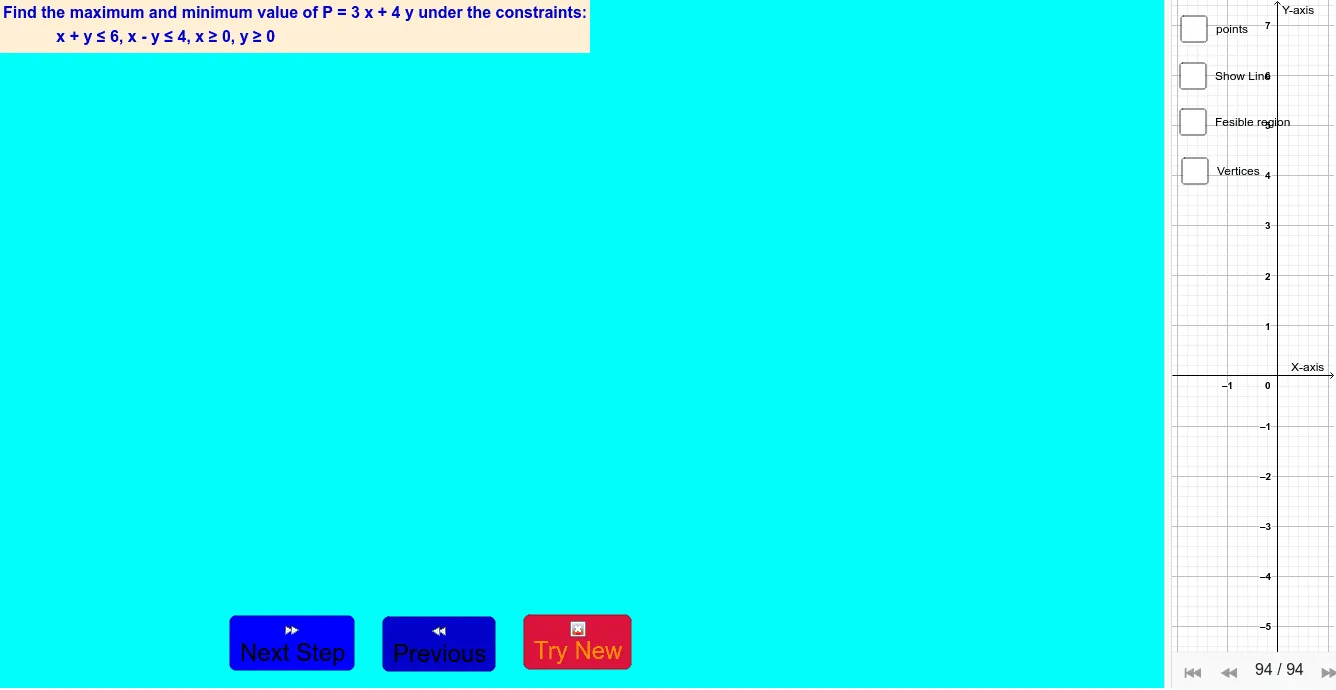
① This GeoGebra example demonstrates linear programming by visualizing the feasible region and optimal solution under multiple linear constraints, allowing users to adjust parameters interactively. ② Core mathematical concepts include linear programming, systems of linear inequalities, feasible regions, objective functions, optimization (max/min), and geometric representation of constraints. ③ Construction highlights: uses commands such as Sequence, RemoveUndefined, Remove, Textfield, Max, Min, and Element; involves numerous objects (a, b, c, i, d, e, f, l, g, h, m, j, k, n, o), ten input boxes (InputBox1-10), equations (eq1-4), and text labels (text2, text4, text7) to build a dynamic solver. ④ Suitable for high school and early college students learning linear programming or introductory operations research, as well as for classroom demonstrations to help students intuitively grasp the relationship between constraints and optimal solutions.
GeoGebra Commands & Parameters
Sequence(IsInRegion[Element[l9, i], o], i, 1, Length[l9]) → l10RemoveUndefined(Sequence[IndexOf[false, l10, i], i, 1, Length[l9]]) → l11Remove(l9, Sequence[Element[l9, Element[l11, i]], i, 1, Length[l9]]) → l12Textfield(a) → InputBox1Textfield(b) → InputBox2Textfield(c) → InputBox3Textfield(d) → InputBox4Textfield(e) → InputBox5Textfield(f) → InputBox6Textfield(g) → InputBox7Textfield(h) → InputBox8Textfield(j) → InputBox9Textfield(k) → InputBox10Textfield(q) → InputBox11Textfield(u) → InputBox12Textfield(l2) → InputBox14Textfield(w) → InputBox13Textfield(l5) → InputBox15Textfield(l6) → InputBox16Sequence(b1(Element[l12, i]), i, 1, Length[l12]) → l13Max(l13) → b_1Min(l13) → c_1Element(l12, IndexOf[Min[l13], l13]) → CElement(l12, IndexOf[Max[l13], l13]) → D
AI Drawing Prompt Reference
Create a visualization for linear programming, showing the feasible region and optimal solution under multiple linear constraints. Include sliders as parameters for user interaction. Display the feasible region defined by inequalities in different colors, highlighting the optimal solution within it. Ensure the graph updates dynamically as parameters change, demonstrating the relationship between constraints and the optimal solution for educational purposes.
The prompt above was compiled from the original drawing commands and is for reference only.