
Products of Linear Functions Demo
Loading the math board and drawing, please wait…
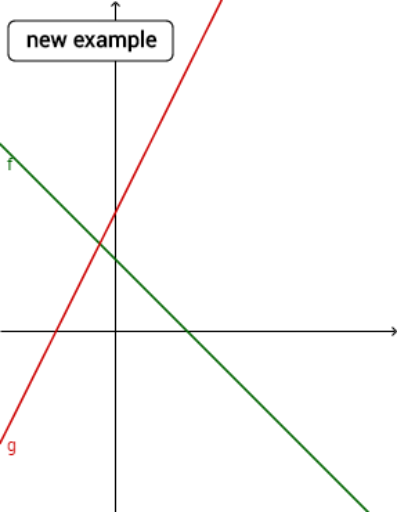
This example demonstrates the graph of the product of two linear functions and its variations. Key math concepts include linear functions, function multiplication, and graph transformations. It is constructed using GeoGebra commands like Random for generating random coefficients a, b, c, d, f, g, h, and a button (button1) for interactive control. Suitable for high school mathematics education to understand the properties and graph characteristics of function products.
GeoGebra Commands & Parameters
Random(-3, 3) → aRandom(-5, 5) → bRandom(-3, 3) → cRandom(-5, 5) → d
AI Drawing Prompt Reference
Plot two linear functions y=ax+b and y=cx+d, and then show the graph of their product. First, randomly generate the coefficients a, b, c, and d within the ranges -3 to 3 and -5 to 5. Then draw these two lines and finally plot the graph of their product to observe its characteristics and transformation patterns.
The prompt above was compiled from the original drawing commands and is for reference only.