
Probability Visualization of Bayes' Theorem
Loading the math board and drawing, please wait…
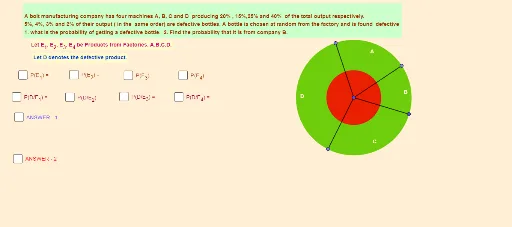
This GeoGebra example provides an interactive visual demonstration of Bayes' theorem, illustrating the relationship between prior probability, likelihood, and posterior probability. The core mathematical concepts include conditional probability, the law of total probability, and Bayes' formula, with geometric representation of event intersections. Construction details: using commands such as Circle, Segment, Point, and Angle to create circular regions and dividing segments; points A, B, C, D, E mark event areas; angles α, β, γ, δ represent probability proportions; text objects text1 through text19 dynamically display probability values and formulas. Suitable for high school and university probability and statistics courses, this tool helps students grasp the intuitive meaning and computational process of Bayes' theorem, and serves as an effective classroom demonstration aid for teachers.
GeoGebra Commands & Parameters
Circle(A, B) → cSegment(A, B) → fPoint(c) → CPoint(c) → DPoint(c) → ESegment(A, D) → gSegment(A, E) → hSegment(A, C) → iAngle(C, A, B) → αAngle(B, A, E) → βAngle(E, A, D) → γAngle(D, A, C) → δ