
Probability Venn Diagram by Micky Bullock
Loading the math board and drawing, please wait…
In collections
Probability Venn Diagrams
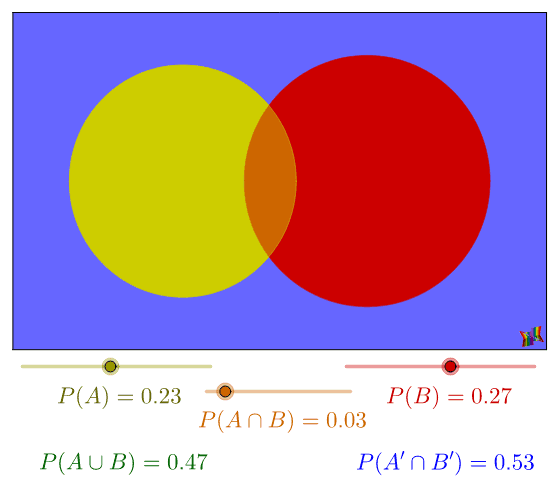
This is a probability Venn diagram that allows you to directly control the probabilities of events A and B. It demonstrates key concepts in probability and statistics, such as event probability and intersection probability. Using GeoGebra commands like If, Circle, Polygon, etc., you can dynamically change the probabilities and observe the changes in the Venn diagram. Suitable for high school math education and learning probability concepts.
GeoGebra Commands & Parameters
If(Min[aPA, aPB] ≟ 0.26 ∧ (abs(Max[aPA, aPB] - 0.28) ≤ 0.01) ∧ aPAnB ≟ 0.25, 0.4, If[(Min[aPA, aPB] - aPAnB ≤ 0.02) ∧ (aPAnB > 0.26), (abs(r_A - r_B) + Max[r_A, r_B]) / 5, Max[r_A, r_B]]) → startvalueIf(r_A + r_B + A6 ≥ 1.618^(0.5), 1.618^(0.5) - r_A - r_B, If[aPAnB ≟ Min[aPA, aPB], Max[r_A, r_B] - Min[r_A, r_B], If[aPAnB ≟ 0, r_A + r_B, A6]]) → separationxIf(r_A + r_B + A6 ≥ 1.618^(0.5), If[aPAnB ≟ 0, ((r_A + r_B)^(2) - separationx^(2))^(0.5), (A6^(2) - (1.618^(0.5) - r_A - r_B)^(2))^(0.5)], 0) → separationyIf(r_A + r_B + A6 ≥ 1.618^(0.5), (separationy - r_A + r_B) / 2, 0) → yACircle(A, r_A) → PACircleCircle(B, r_B) → PBCirclePolygon(C, D, E, F) → poly1, c, d, e, fCircle(A, r_A) → PACircle2Circle(A, r_A) → PAGreenCircleCircle(B, r_B) → PBGreenCircleIntersect(PACircle, PBCircle) → G, H, ,CircleArc(A, H, G) → gIf(aPA ≟ 0.2 ∧ aPB ≟ 0.2 ∨ aPA ≟ 0.19 ∧ aPB ≟ 0.19, 0, Cell[SScol, SSrow]) → aMinPAnB