
Probability Simulator
Loading the math board and drawing, please wait…
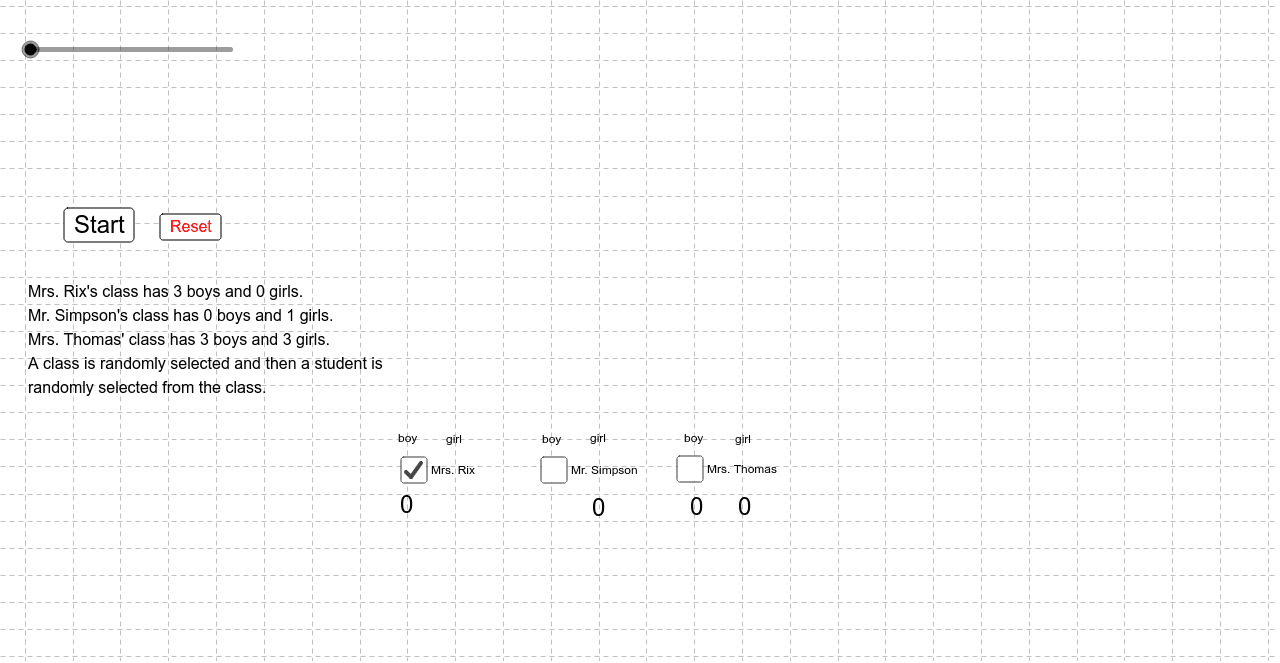
This example demonstrates the basic principles of probability simulation. The core mathematical concepts include probability and statistics. Random number generators and conditional statements are used to simulate the process of drawing balls of different colors. GeoGebra commands used include Random and If. Suitable for students at the junior high school level and above for learning probability and statistics.
GeoGebra Commands & Parameters
Random(1, 3) → classIf(a ∧ (student < R_b / (R_b + R_g)), 3, If[a ∧ (student > R_b / (R_b + R_g)), 4, If[b ∧ (student < S_b / (S_b + S_g)), 6, If[b ∧ (student > S_b / (S_b + S_g)), 7, If[c ∧ (student < T_b / (T_b + T_g)), 9, 10]]]]) → A_xIf(A_x ≟ 3, (A_x, x(countRb)), If[A_x ≟ 4, (A_x, x(countRg)), If[A_x ≟ 6, (A_x, x(countSb)), If[A_x ≟ 7, (A_x, x(countSg)), If[A_x ≟ 9, (A_x, x(countTb)), (A_x, x(countTg))]]]]) → G
AI Drawing Prompt Reference
Create an interactive probability simulator interface. Display three containers labeled R, S, and T, each holding a mix of blue and green balls. Below each container, place a slider to adjust the ratio of blue to green balls. On the right side, show a random number generator that outputs a value between 1 and 3, selecting one of the containers. During each simulation, a ball is randomly drawn from the chosen container, and a corresponding colored block (blue or green) is added to a bar chart for that container. The bar charts update in real time to show cumulative counts of blue and green draws for each container. Keep the layout clear and suitable for classroom demonstration.
The prompt above was compiled from the original drawing commands and is for reference only.