
Probability Perspective
Loading the math board and drawing, please wait…
In collections
Learn GeoGebra Classic
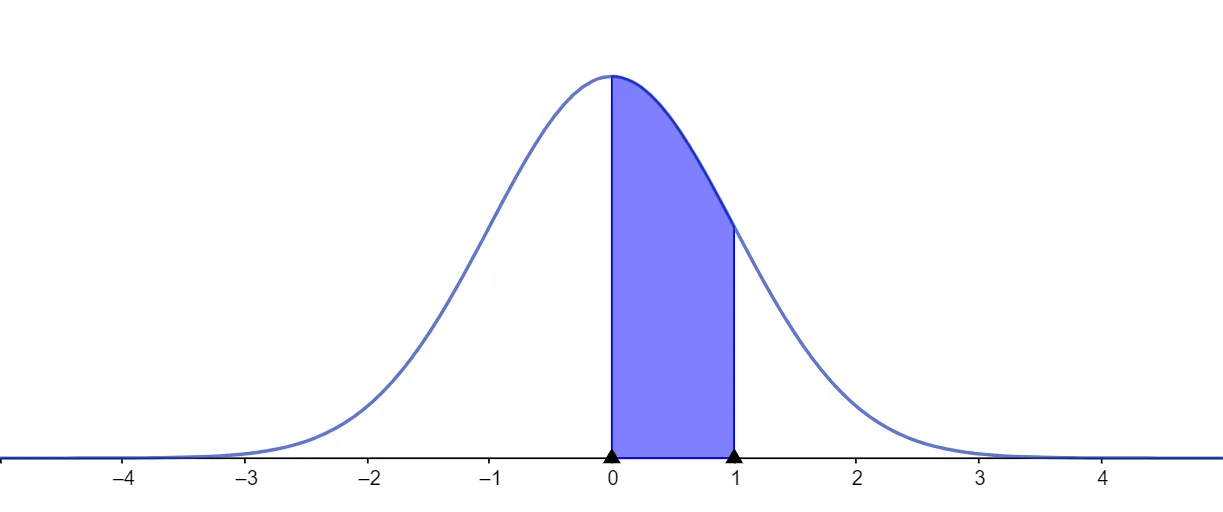
This example uses the Statistics Calculator to learn about basic concepts and applications in probability and statistics. It demonstrates how to use the Statistics Calculator for data processing and probability analysis. By following the construction summary, you can understand how to perform probability calculations and visualization using GeoGebra. Suitable for high school students and teachers.
AI Drawing Prompt Reference
Create a probability distribution graph to show data analysis. First, input a set of data, then use the Statistics Calculator to compute basic statistical indicators such as mean, median, and standard deviation. Next, draw a histogram and line graph to visualize the data distribution and trends. Finally, use these data for probability calculations, such as calculating the probability of data within a specific range.
The prompt above was compiled from the original drawing commands and is for reference only.