
Probability Distribution Tool: Optional Input
Loading the math board and drawing, please wait…
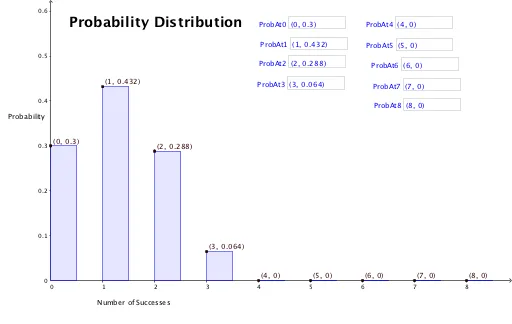
This example demonstrates how to use GeoGebra to visualize probability distributions, particularly bar charts and ellipses. Core math concepts include probability distributions, ellipse equations, exponential functions, unit circle, and quadratic functions. Construction highlights involve using commands like Point, Polygon, and Textfield, along with objects such as A, B, f, g, h, i, j, k, l, m, C, D, E, F, G, H, I, J, K, L, M, N, O, P, Q, R, S, T, U, V, W, Z, A_1, B_1, C_1, D_1, E_1, F_1, G_1 for parametric operations. Suitable for high school and above students learning probability statistics and geometric constructions.
GeoGebra Commands & Parameters
Point(yAxis) → BPoint(f) → CPoint(g) → DPoint(h) → EPoint(i) → FPoint(j) → GPoint(k) → HPoint(l) → IPoint(m) → JPolygon(B, A, S, T) → poly1, b, a, s, tPolygon(C, K, U, V) → poly2, c, k_1, u, vPolygon(D, L, W, Z) → poly3, d, l_1, w, z_1Polygon(E, M, A_1, B_1) → poly4, e, m_1, a_1, b_1Polygon(F, N, C_1, D_1) → poly5, f_1, n, c_1, d_1Polygon(G, O, E_1, F_1) → poly6, g_1, o, e_1, f_2Polygon(H, P, G_1, H_1) → poly7, h_1, p, g_2, h_2Polygon(I, Q, I_1, J_1) → poly8, i_1, q, i_2, j_1Polygon(J, R, K_1, L_1) → poly9, j_2, r, k_2, l_2Textfield(B) → InputBox1Textfield(C) → InputBox2Textfield(D) → InputBox3Textfield(E) → InputBox4Textfield(F) → InputBox5Textfield(G) → InputBox6Textfield(H) → InputBox7Textfield(I) → InputBox8Textfield(J) → InputBox9