
Probability and Relative Frequency
Loading the math board and drawing, please wait…
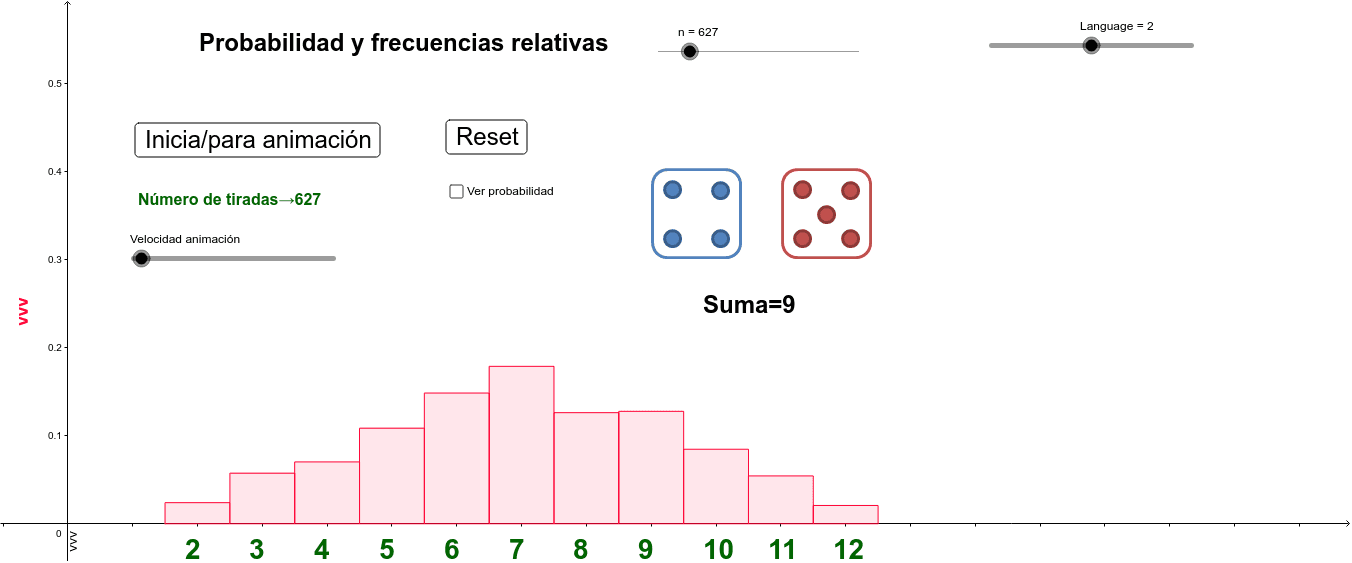
This example demonstrates the relationship between relative frequency and probability through a dice-throwing experiment. It involves core concepts of probability and statistics, using GeoGebra commands such as Sequence, Histogram, Join, etc., to create a dynamic dice-throwing model. Suitable for students at the middle school level and above.
GeoGebra Commands & Parameters
Sequence(Text[j, (j - 0.2, -0.04)], j, 2, 12) → resultatsSequence(Random[1, 6], j, 1, n) → dau1Sequence(Random[1, 6], j, 1, n) → dau2Sequence(1.5 + j, j, 0, 11) → intervalsHistogram(intervals, fr) → hSequence(j / 36, j, 1, 6) → p1Sequence(j / 36, j, 5, 1, -1) → p2Join({p1, p2}) → probabilitatsHistogram(intervals, probabilitats) → prElement(suma, n) → sVerticalText("vvv") → t1VerticalText("vvv") → texto5