
Presidential Statistics: Piecewise Linear Regression and Boxplot
Loading the math board and drawing, please wait…
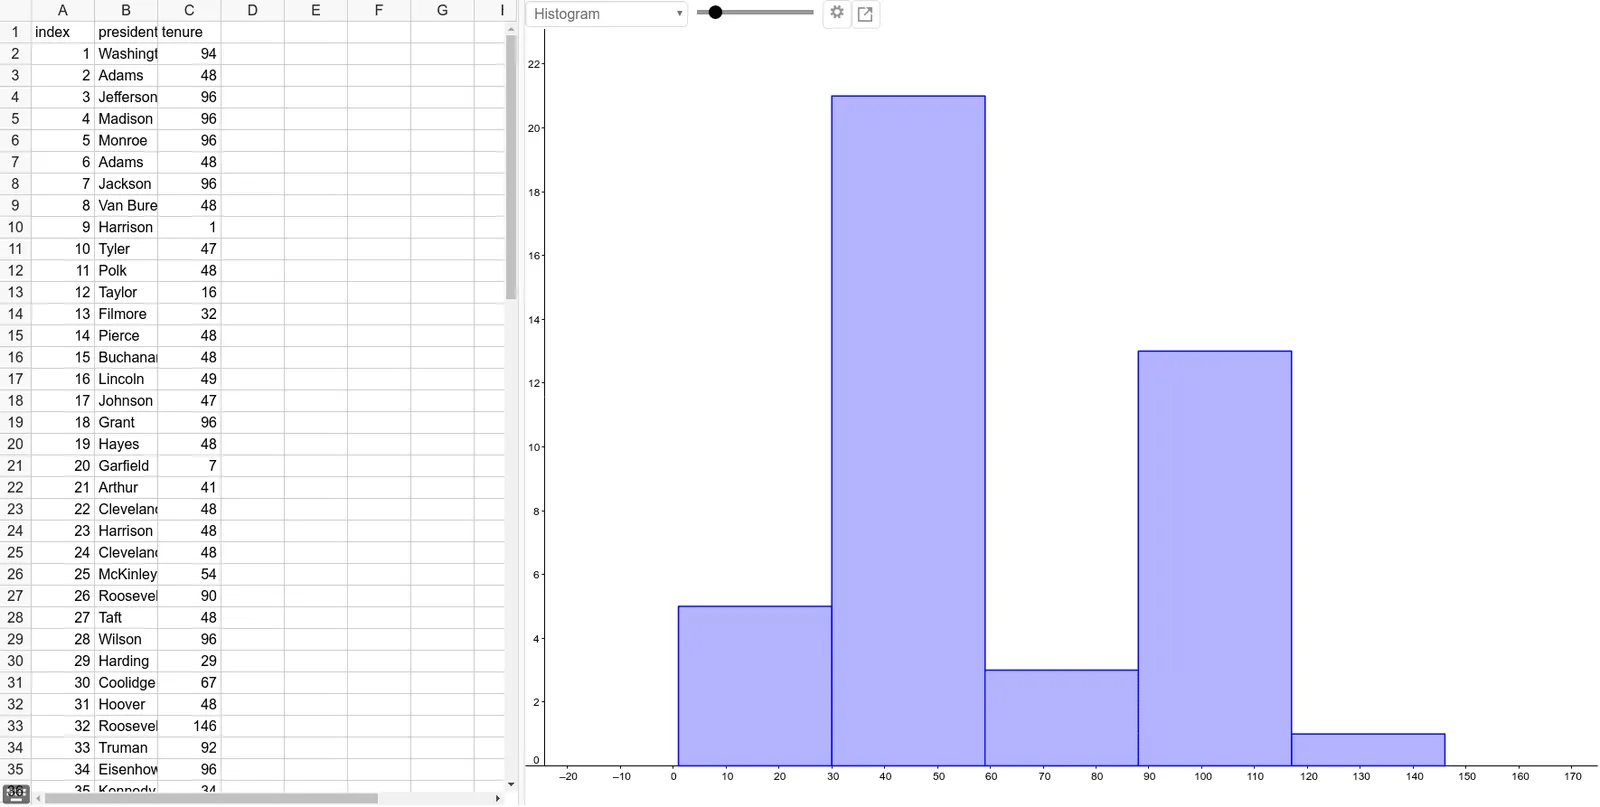
This GeoGebra example demonstrates how to analyze statistical data related to U.S. presidents (such as term lengths, ages, or approval ratings) through scatter plots, piecewise linear regression, and boxplots. The core mathematical concepts include descriptive statistics, linear regression, piecewise functions, boxplots, natural numbers, and geometric distributions. Construction details: from the summary, numerous point objects (A1, B1, C1, ..., A14) are defined, likely representing data coordinates for scatter plots; piecewise linear regression is applied to fit trends in different intervals, and boxplot tools display quartiles and outliers. This example is suitable for high school or college statistics courses, helping students understand data modeling, regression analysis, and distribution visualization. It also serves as an interdisciplinary project connecting social science and mathematics.
GeoGebra Commands & Parameters
1942483964965966487968489110471148121613321448154816491747189619482072141224823482448255426902748289629293067