
Practice: Writing the Equation of a Line Given Slope and Point
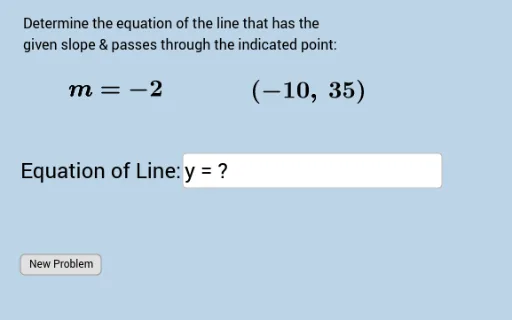
Loading the math board and drawing, please wait…
In collections
Linear Functions Unit
This GeoGebra example dynamically illustrates the process of writing a line's equation given a slope and a point, specifically focusing on cases where the y-intercept is an integer. It demonstrates how parameter changes affect line position and intercept values. Core mathematical concepts include the point-slope form, slope-intercept form, and integer coordinate properties. Construction involves GeoGebra commands such as Random, Line, FractionText, and Textfield, along with objects like points, lines, and input boxes. Suitable for middle and high school mathematics, particularly in algebra and coordinate geometry units, it helps students visualize how slope and points determine a line's equation and position.
GeoGebra Commands & Parameters
Random(-20, 20) → bRandomElement(klist) → krandRandomElement(xmovelist) → randxRandomElement(ymovelist) → randyLine(A, B) → fFractionText(Slope[f]) → text1Textfield(g) → InputBox1
AI Drawing Prompt Reference
Draw a straight line graph determined by slope and a point. The graph should include a point and a line, where the line passes through the point with the given slope. The line's position and slope can vary, and its intersection with the axes can be shown. The graph should clearly illustrate the relationship between the line, point, and slope to help understand the equation of the line.
The prompt above was compiled from the original drawing commands and is for reference only.