
Practice Transformations Graph
Loading the math board and drawing, please wait…
In collections
Grade 12 PreCalculus BC
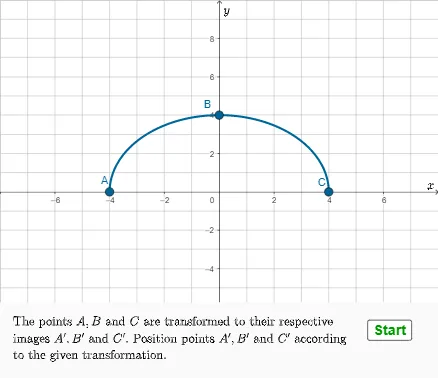
This example demonstrates the transformation of a function graph by manipulating points on the graph. It involves core mathematical concepts such as function graphs, translation, logic, geometry, conic sections, special points, and maxima/minima. The construction utilizes GeoGebra commands and objects like Random, If, RandomElement, Max, Min, Corner; objects: qQ, c, cC, absc, fn, xc, blist, b, bB, xa, f2, f3, f1, f, A, B, C, alist, a, aA, d, dD, g, xbim, xaim, AANS, BANS, xcim, CANS, xmax, xmin, ymax, ymin1, A', B', C', vscale, ymin2, e, atext. Suitable for high school students learning about function graph transformations.
GeoGebra Commands & Parameters
Random(-8, 8) → cIf(qQ ≟ 2 ∨ qQ ≟ 3 ∨ qQ ≟ 4, 0, c) → cCIf(fn ≟ 3, 4, 2) → xcRandomElement(blist) → bIf(qQ ≟ 1 ∨ qQ ≟ 2 ∨ qQ ≟ 5, 1, b) → bBIf(fn ≟ 3, -4, -2) → xaIf(fn ≟ 1, f1, If[fn ≟ 2, f2, f3]) → fIf(fn ≤ 2, (-2, f(-2)), (-4, f(-4))) → AIf(fn ≤ 2, (2, f(2)), (4, f(4))) → CRandomElement(alist) → aIf(qQ ≟ 1 ∨ qQ ≟ 3, 1, a) → aARandom(-10, 10) → dIf(qQ ≟ 4, 0, d) → dDIf(bB > 0, xa / abs(bB) + cC, ((-xa)) / abs(bB) + cC) → xaimIf(bB > 0, xc / abs(bB) + cC, ((-xc)) / abs(bB) + cC) → xcimMax({4 / abs(bB) + cC, 8}) → xmaxMin({-4 / abs(bB) + cC, -8}) → xminMax({6, y(AANS) + 2, y(BANS) + 2, y(CANS) + 2}) → ymaxMin({-5.8, y(AANS) - 1.8, y(BANS) - 1.8, y(CANS) - 1.8}) → ymin1If(aA ≟ 1, "", If[aA ≟ -1, "-", Text[aA]]) → atextIf(cC ≟ 0, "", If[cC < 0, ("+" * Text[absc]), ("-" * Text[absc])]) → ctextIf(bB ≟ 1, "", If[bB ≟ -1, "-", Text[bB]]) → btextIf(dD ≟ 0, "", If[dD > 0, ("+" * Text[dD]), Text[dD]]) → dtextIf(qQ ≟ 1, q1text1, If[qQ ≟ 2, q2text2, If[qQ ≟ 3, q3text3, If[qQ ≟ 4, q4text4, If[qQ ≟ 5, q5text5, q6text6]]]]) → qftextCorner(5) → dims
AI Drawing Prompt Reference
Create a practice graph for function transformations. Show a coordinate plane with one of three base function curves selected. Mark three movable points on the curve with their coordinates. Apply random translations, stretches, and reflections to the function, displaying the transformed curve in a distinct style. Adjust the axis ranges automatically to fit the transformed graph. Label the transformed function expression. Include markers for maximum and minimum points. Add interactive controls for selecting the base function and transformation type. Keep the layout clean for classroom use.
The prompt above was compiled from the original drawing commands and is for reference only.