
Practice Graphing Linear Equations
Loading the math board and drawing, please wait…
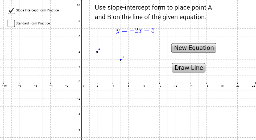
This example demonstrates how to graph linear equations. Key mathematical concepts include linear equations, slope, and y-intercept. Using GeoGebra commands such as Line and Intersect, dynamic linear equation graphs can be created. Suitable for middle school and above students for graphing practice.
GeoGebra Commands & Parameters
Random(-5, 5) → riseRandom(1, 5) → runRandom(-4, 5) → bFractionText(m) → FractionslopeLine(A, B) → cIntersect(c, yAxis) → sbFractionText(sm) → smfractionLine(P, Q) → fLine(A, B) → l