
Graphing Polynomial Inequalities
Loading the math board and drawing, please wait…
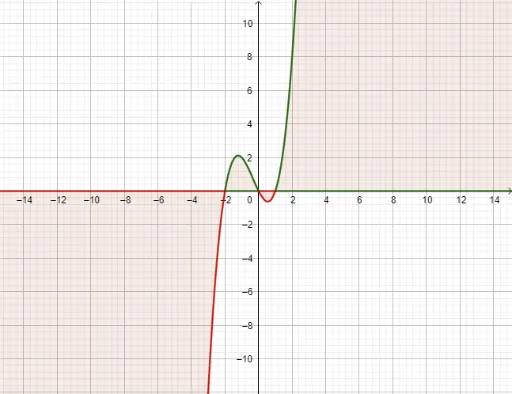
This example demonstrates how to graph the solution set of polynomial inequalities. Key math concepts include inequality solution sets, function graphs, and area shading. Construction highlights using GeoGebra commands/objects from the summary: IntegralBetween (for integral calculation), Textfield (for text input), Polynomial (for polynomial functions); objects: f (function), ShadedArea (shaded region), inpF (input box), g (graph), txtExpFac (text expression), posAxis (positive axis), negAxis (negative axis), posF (positive function), negF (negative function). Suitable for high school and above mathematics learning, to understand the relationship between inequalities, function graphs, and area representation.
GeoGebra Commands & Parameters
IntegralBetween(f, 0, -2000, 2000) → ShadedAreaTextfield(f) → inpFPolynomial(f) → g
AI Drawing Prompt Reference
Draw a graph showing the solution set of a polynomial inequality, including function graphs and area shading, start by plotting the function, then calculate the integral to determine the shaded region based on the inequality, and use a text box for inputting the function expression, finally presenting the relationship among the function graph, shaded area, and input box.
The prompt above was compiled from the original drawing commands and is for reference only.