
Power Functions y=ax^(1/n), n is positive and odd
Loading the math board and drawing, please wait…
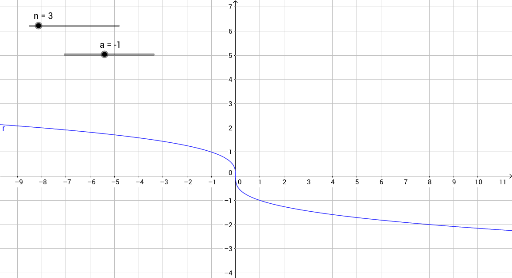
This example demonstrates the behavior of power functions y=ax^(1/n) where n is positive and odd, showing how the graph changes with parameters a and n. Key math concepts include power functions, parameter influence, and function graph transformations. Constructed using GeoGebra's slider objects for n and a, and locus command for graphing. Suitable for high school mathematics teaching to understand the properties of power functions and the effect of parameters on the graph.
GeoGebra Commands & Parameters
Numeric n(3)Numeric a(-1)r(x) = (a * x^(1 / n))
AI Drawing Prompt Reference
Plot the graph of y=ax^(1/3), where a is a variable ranging from -1 to 1. Use a slider to adjust the value of a and observe how the graph changes.
The prompt above was compiled from the original drawing commands and is for reference only.