
Power Functions Demo
Loading the math board and drawing, please wait…
In collections
Mathematics (Power Functions)
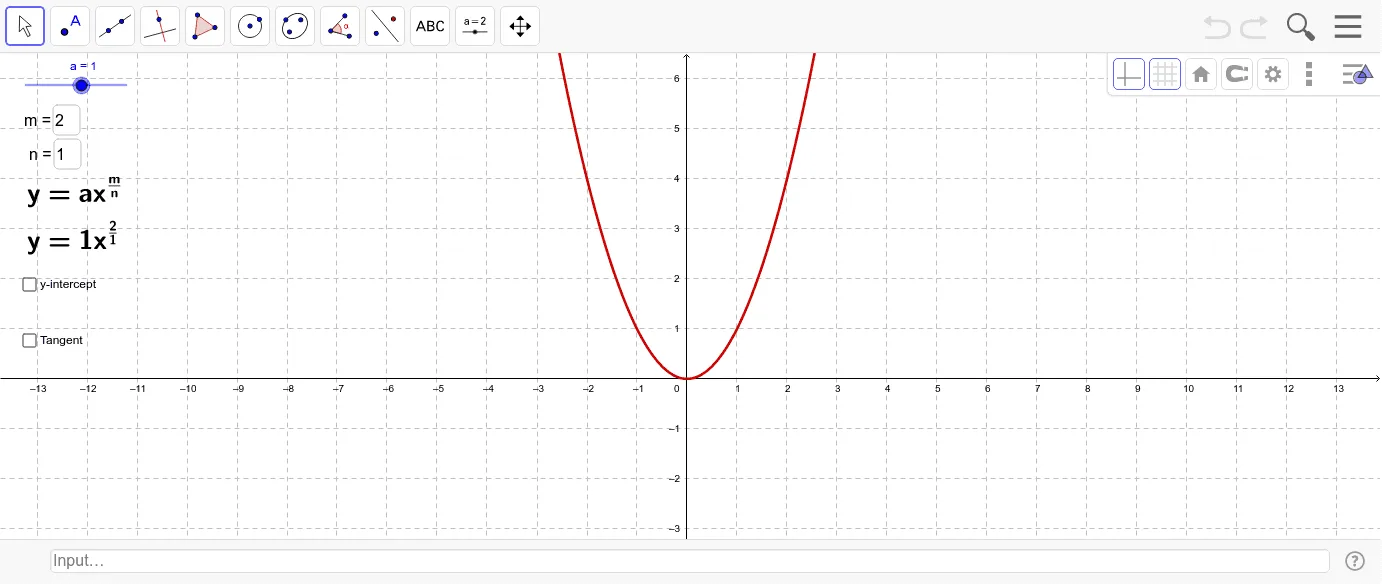
This example demonstrates the behavior of power functions f(x)=x^n, including graph transformations, derivatives, and tangents. It involves constructing points, tangents, and calculating slopes using GeoGebra commands like Point, Tangent, Intersect, Slope, and Textfield with objects such as sliders a, m, n, and text elements. Ideal for high school and college students and educators studying function analysis and calculus.
GeoGebra Commands & Parameters
Point(f) → ATangent(A, f) → eIntersect(f, yAxis, 1) → DSlope(e) → kTextfield(m) → inputBox1Textfield(n) → inputBox2
AI Drawing Prompt Reference
Draw the graph of a power function f(x)=x^n, including its curve, a tangent line at point P, and the intersection with the y-axis. Use sliders to control the exponent n and the x-coordinate of the tangent point m, with input boxes for these values. Mark point E on the tangent line, point D at the y-axis intersection, and calculate the slope k of the tangent line, displaying it.
The prompt above was compiled from the original drawing commands and is for reference only.