
Polynomial Intersections
Loading the math board and drawing, please wait…
In collections
Learn GeoGebra Classic
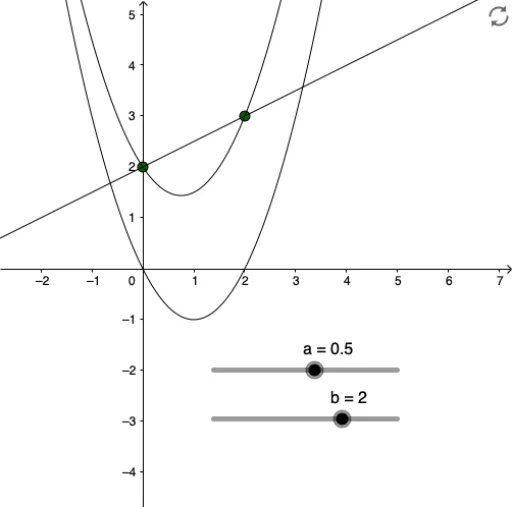
This example demonstrates the graphs of two polynomial functions and their intersection points. Key math concepts include polynomial functions, graph intersections, and coordinate geometry. It uses GeoGebra commands/objects: f (function 1), a,b (parameters), g,h (functions), list1 (list). Suitable for high school mathematics, helping students understand the geometric meaning and calculation of function intersections.
GeoGebra Commands & Parameters
f(x) = x^(2) - (3 / 2 * x) + 2Numeric a(0.5)Numeric b(2)Function gFunction hList list1
AI Drawing Prompt Reference
Plot the graphs of two polynomial functions and mark their intersection points. One function is x squared minus 1.5 times x plus 2, and the other is controlled by parameters a and b, with a set to 0.5 and b set to 2. First, draw the graphs of these two functions, then mark the intersection points on the graph to show the geometric meaning of polynomial function intersections and their coordinates.
The prompt above was compiled from the original drawing commands and is for reference only.