
Polynomial Functions and Transformations
Loading the math board and drawing, please wait…
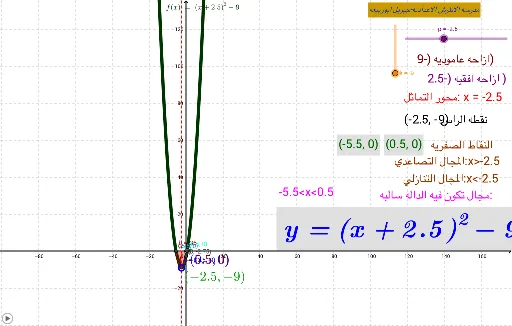
This example demonstrates polynomial functions and their transformations. Key mathematical concepts include the properties and transformations of polynomial functions. Using GeoGebra commands such as Line, Intersect, and Integral, the example dynamically shows the graphs of polynomial functions and their transformations. Suitable for high school mathematics education and learning.
GeoGebra Commands & Parameters
Line(A, yAxis) → aIntersect(f, xAxis, 2) → BIntersect(f, xAxis, 1) → CIntegral(f, x(C), x(B)) → bIntersect(f, yAxis, 1) → DIntersect(f, yAxis, (0, -2.75)) → EIntersect(f, xAxis, 2) → FIntersect(f, xAxis, 1) → G
AI Drawing Prompt Reference
Draw a polynomial function and its transformations, including the points where the function intersects the x-axis and y-axis, and the area under the curve between two x-axis intersections. First, draw a line passing through the origin, then plot a polynomial function, find the two x-axis intersections of the function, calculate the area under the curve between these two points, and locate the two y-axis intersections of the function.
The prompt above was compiled from the original drawing commands and is for reference only.