
Polar Parabola
Loading the math board and drawing, please wait…
In collections
Conics Doug Kuhlmann
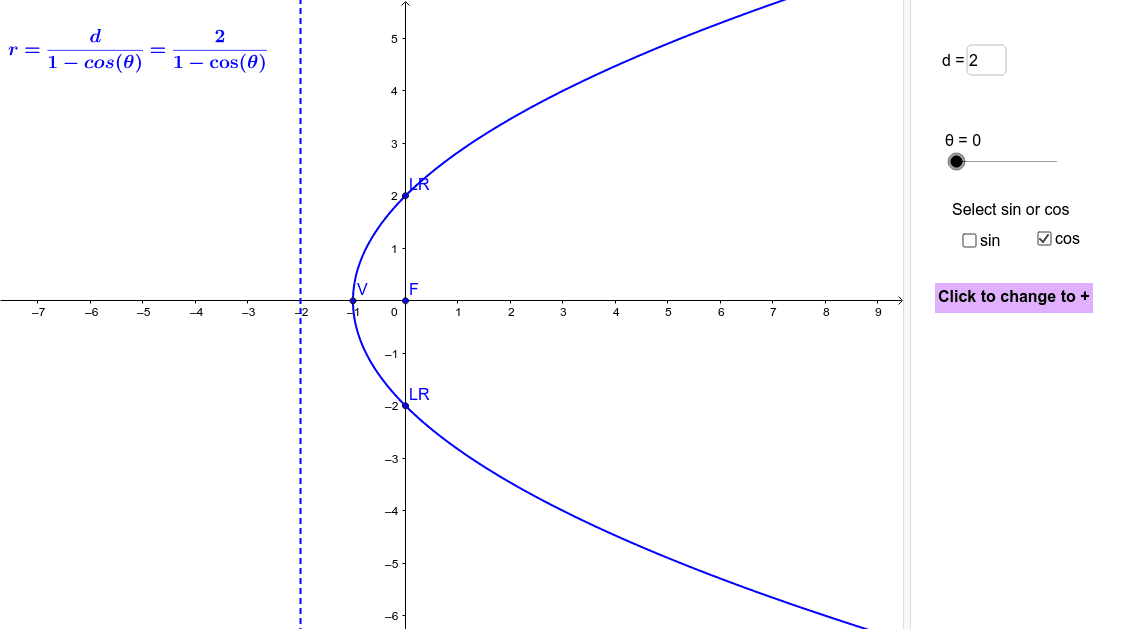
This example demonstrates a parabola in polar coordinates. It involves the core concepts of parabolas and exponential functions. Using GeoGebra commands such as CurveCartesian, Textfield, Vector, and If, the polar equation of the parabola can be constructed. Suitable for high school mathematics education and learning.
GeoGebra Commands & Parameters
CurveCartesian((rc(t) * cos(t)), (rc(t) * sin(t)), t, 0, 6.283185307179586) → rpcTextfield(d) → dEQVector(rpc(θ)) → vIf(togneg ≟ 1, "Click to change to +", "Click to change to -") → PlusMinusCurveCartesian((rs(t) * cos(t)), (rs(t) * sin(t)), t, 0, 6.283185307179586) → rpsIf(togneg ≟ 0, "+", "-") → tgnVector(rps(θ)) → w
AI Drawing Prompt Reference
Draw a parabola in polar coordinates using parameter t from 0 to 2π. Create a text field showing 'Click to switch sign'. Based on the value of togneg, draw two parabolas in opposite directions, one labeled with a plus sign and the other with a minus sign.
The prompt above was compiled from the original drawing commands and is for reference only.