
Polar Graphs - Multiples of Theta
Loading the math board and drawing, please wait…
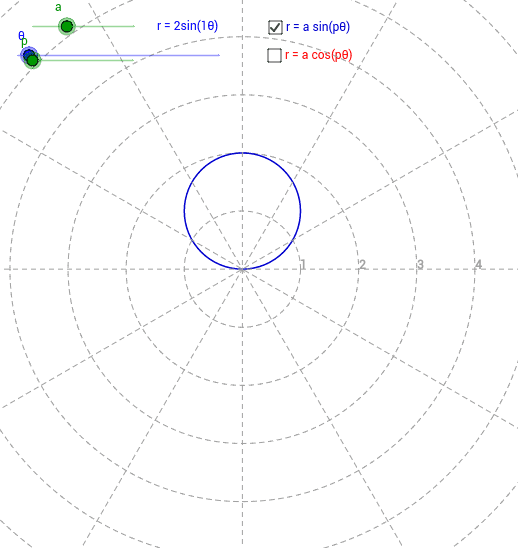
This example demonstrates the polar curve generated by the equation r = a cos(pt) and how it changes with parameters a and p. Key math concepts include polar coordinate systems, trigonometric functions, and function graph transformations. GeoGebra commands used are Intersect, Point, Circle, Line, and CurveCartesian. Suitable for high school students learning about function properties, parametric equations, and polar coordinates in mathematics education.
GeoGebra Commands & Parameters
Intersect(xAxis, yAxis) → BPoint(xAxis) → CCircle(B, C) → cCircle(B, D) → dCircle(B, E) → eCircle(B, F) → fPoint(xAxis) → GCircle(B, G) → gCircle(B, H) → hCircle(B, I) → kLine(M, B) → aLine(L, B) → bLine(K, B) → iLine(J, B) → jPoint(xAxis) → ACircle(B, A) → pPoint(xAxis) → NCircle(B, N) → qPoint(xAxis) → OCircle(B, O) → rCircle(B, P) → sIntersect(c, yAxis, 2) → QLine(B, Q) → lIntersect(c, xAxis, 1) → RLine(B, R) → mCurveCartesian(a_1 * cos(p_1 * t) * cos(t), a_1 * cos(p_1 * t) * sin(t), t, 0, 6.28319) → r_pCurveCartesian(a_1 * sin(p_1 * t) * cos(t), a_1 * sin(p_1 * t) * sin(t), t, 0, 6.28319) → r_q
AI Drawing Prompt Reference
Draw a polar coordinate curve showing the graph of r = a cos(pt) and its variations with parameters a and p. Start by plotting the x and y axes and their intersection at the origin. Draw several concentric circles centered at the origin, and mark points on the axes. Connect the origin to the intersection points of the circles with lines, then plot the curve to visualize the function's behavior as a and p change.
The prompt above was compiled from the original drawing commands and is for reference only.