
Polar Equation Plotter
Loading the math board and drawing, please wait…
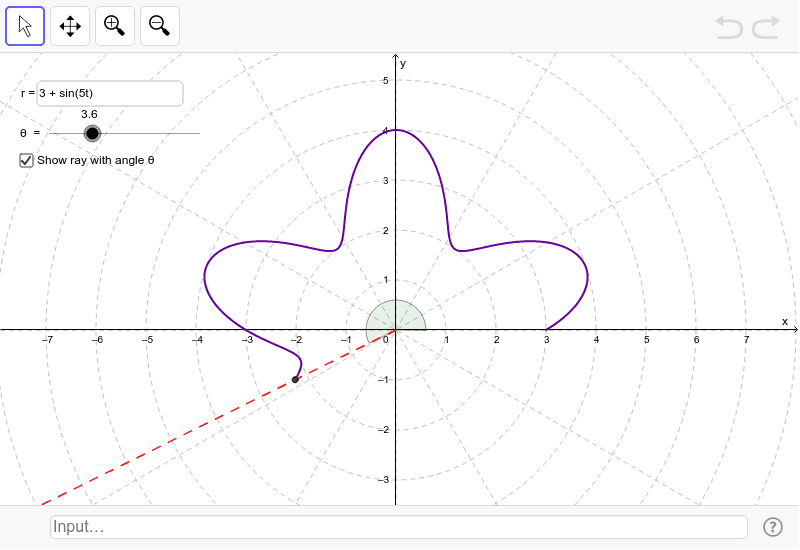
This example demonstrates how to plot equations of the form r = f(θ) in polar coordinates. It involves basic concepts of polar coordinates, such as angles and radii. Using GeoGebra commands like CurveCartesian, Point, Ray, and Angle, various polar curves can be easily drawn. Suitable for high school mathematics education, particularly for learning coordinate geometry and trigonometry.
GeoGebra Commands & Parameters
Textfield(f) → inputBox1CurveCartesian(f(t) * cos(t), f(t) * sin(t), t, 0, a) → bPoint(b) → BRay((0, 0), (cos(a), sin(a))) → cAngle(xAxis, c) → θ
AI Drawing Prompt Reference
Plot a polar coordinate graph based on the equation r=f(θ). First, input the equation f(θ), then draw a ray c starting from the origin, followed by the polar curve b, and finally mark a point B on the curve b.
The prompt above was compiled from the original drawing commands and is for reference only.