
Polar Curves Drawing
Loading the math board and drawing, please wait…
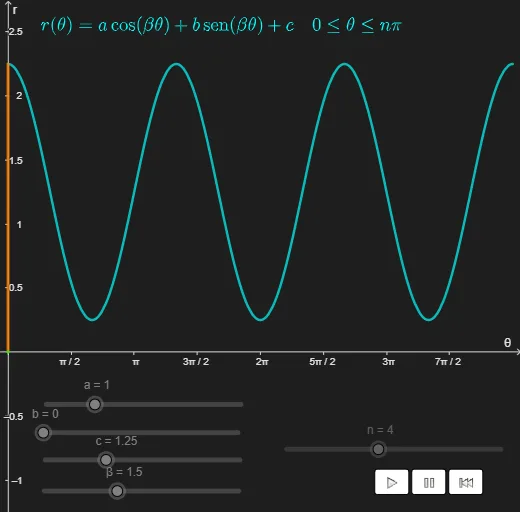
This example demonstrates how to draw curves in polar coordinates. Key math concepts include polar coordinates, function graphs, and geometric transformations. Construction highlights involve commands like Segment, Rotate, Angle, Max, Min, CurveCartesian, and objects such as n, T, θ, β, c, b, a, etc. Suitable for high school and above students learning polar geometry and calculus applications.
GeoGebra Commands & Parameters
Segment((θ, 0), (θ, f(θ))) → hSegment((0, 0), ((f(θ) * cos(θ)), (f(θ) * sin(θ)))) → iRotate((1, 0), θ, (0, 0)) → ZAngle((1, 0), (0, 0), Z) → γSegment((0, 0), (θ, 0)) → jMax(f, 0, T) → DMin(f, 0, T) → ECurveCartesian((f(t) * cos(t)), (f(t) * sin(t)), t, 0, θ) → d
AI Drawing Prompt Reference
Draw a polar curve using angle θ and function f(θ). First, draw a line segment from the origin to point (θ, f(θ)). Then, draw a line segment from the origin to point (f(θ) * cos(θ), f(θ) * sin(θ)). Rotate the unit vector around the origin to get angle γ. Draw another line segment from the origin to point (θ, 0). Find the maximum value D and minimum value E of function f(θ). Finally, draw the polar curve (x = f(t) * cos(t), y = f(t) * sin(t)) for t from 0 to θ.
The prompt above was compiled from the original drawing commands and is for reference only.