
Polar and Parametric Equations
Loading the math board and drawing, please wait…
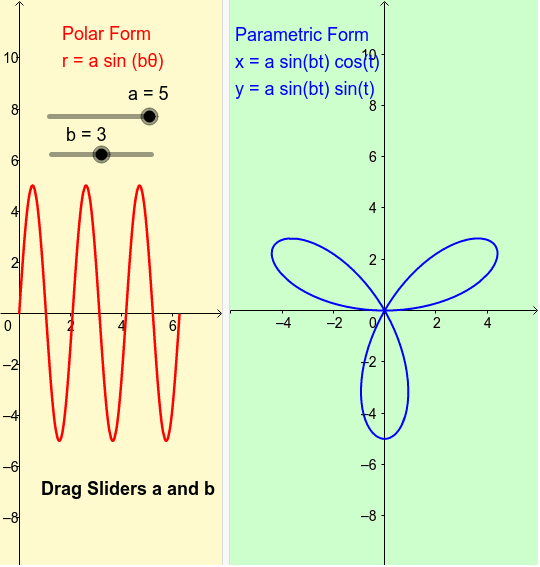
This example demonstrates how to graph polar and parametric equations using GeoGebra, visually showcasing their geometric forms and variation patterns. Core mathematical concepts include polar coordinate systems, parametric equations, function graphs, and derivatives. The construction leverages the GeoGebra command CurveCartesian along with objects a, b, c, f, text1, text2, text3 for parameter control and textual annotations. Suitable for high school and above learners to understand the application and visualization of parametric equations and polar coordinates.
GeoGebra Commands & Parameters
CurveCartesian(((a * sin((b * t))) * cos(t)), ((a * sin((b * t))) * sin(t)), t, 0, 6.28) → c