
Poisson Probability Distribution Interactive Demo
Loading the math board and drawing, please wait…
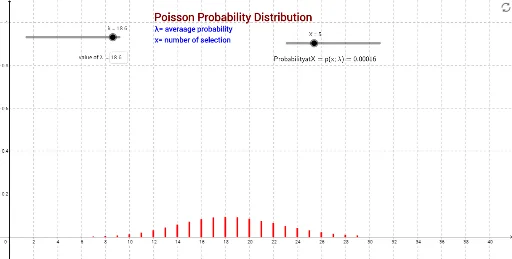
① This example visualizes the Poisson probability distribution through a dynamic bar chart, illustrating how the probability mass function varies with the parameter λ. ② Core mathematical concepts include the Poisson distribution formula P(X=k)=e^(-λ)λ^k/k!, logarithmic functions, arithmetic operations, and statistical characteristics such as mean and variance. ③ Construction highlights: GeoGebra commands Point, BarChart, and Textfield are used; objects include B30, λ, A30, and paired points A1-B19 that store probabilities for different k values, allowing real-time updates when λ changes. ④ It is ideal for high school and undergraduate courses in probability and statistics, serving as an interactive demonstration for understanding discrete distributions and parameter sensitivity.
GeoGebra Commands & Parameters
Point(yAxis) → BBarChart(list2, list1, 0.1) → aTextfield(λ) → InputBox1