
Higher Order Derivative
Loading the math board and drawing, please wait…
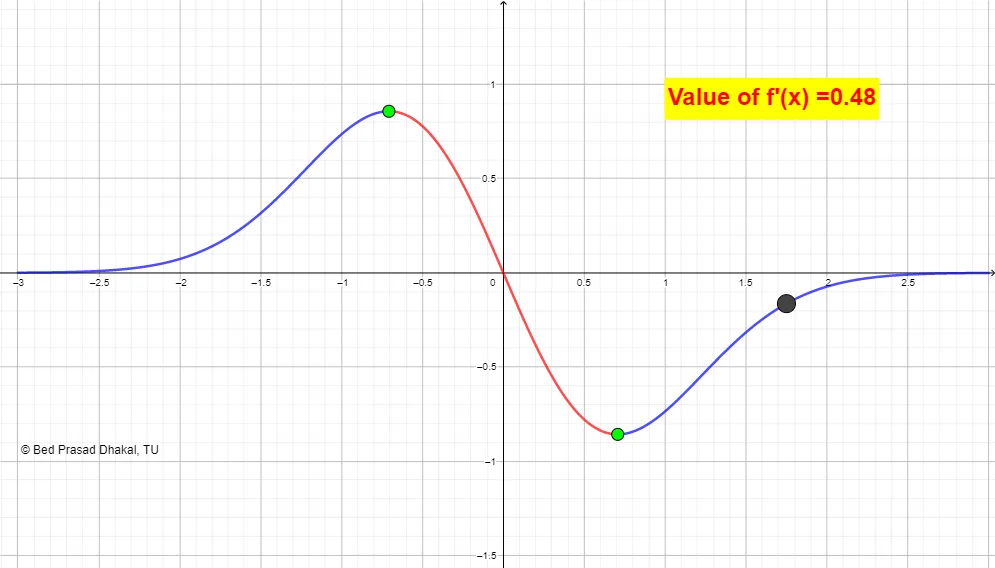
This example demonstrates the geometric meaning of higher order derivatives and their relationship with function graph transformations. Core math concepts include derivatives, function graphs, higher order derivatives, and curve plotting. GeoGebra commands like CurveCartesian, t, f, functionalValue, a, a2, a1, A, B, l1, l3, l2, fvalue, f'value, text2, text1 are used for parametric curve drawing and dynamic visualization. Suitable for high school and above learning calculus, function analysis, and dynamic geometry.
GeoGebra Commands & Parameters
CurveCartesian(t, f(t), t, -3, 3) → aCurveCartesian(t, f''(t), t, -3, 3) → a2CurveCartesian(t, f'(t), t, -3, 3) → a1CurveCartesian(t, f(t), t, -3, -0.71) → l1CurveCartesian(t, f(t), t, 0.71, 3) → l3CurveCartesian(t, f(t), t, -0.71, 0.71) → l2
AI Drawing Prompt Reference
Draw the graph of a function and its first and second derivatives to show their relationships. First, plot the function graph from -3 to 3, then separately plot its first derivative from -3 to -0.71, 0.71 to 3, and -0.71 to 0.71, corresponding to different intervals of the function graph. On the first derivative graph, plot the slopes of the tangent lines for these intervals. On the second derivative graph, plot the concavity changes for these intervals.
The prompt above was compiled from the original drawing commands and is for reference only.