
Poisson Distribution Calculator by kamil_cyrkle
Loading the math board and drawing, please wait…
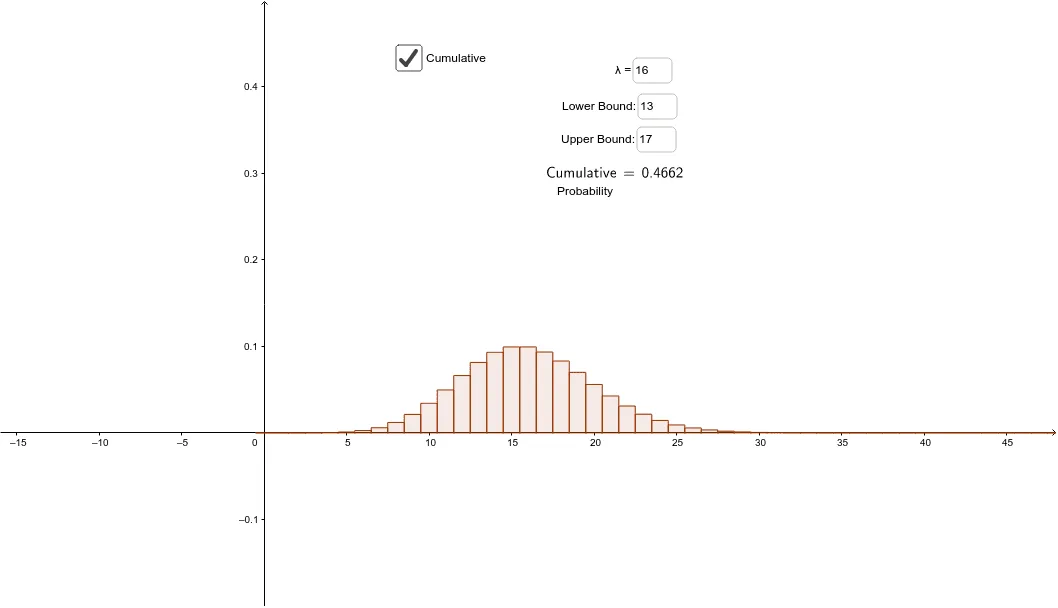
This example demonstrates the calculation and visualization of the Poisson distribution. The core mathematical concepts involved are from probability & statistics, specifically the Poisson distribution, showcasing probability distributions under different parameters λ through dynamic interaction. Construction highlights the use of GeoGebra commands and objects like Poisson, LaTeX, Textfield, and elements such as l, a, m, c, λ, k, Probability, text3, InputBox1, InputBox2, g, h, Cumulative, InputBox3, InputBox4, text1, text2, making it suitable for high school and above students to learn and understand key distribution models in probability statistics.
GeoGebra Commands & Parameters
Poisson(m) → cPoisson(m, l, a) → ProbabilityLaTeX(Probability, true, true) → text3Textfield(m) → InputBox1Textfield(l) → InputBox2Poisson(m, g…h) → CumulativeTextfield(g) → InputBox3Textfield(h) → InputBox4LaTeX(Cumulative, true, true) → text1