
Poisson Approximation to Binomial Distribution by ddca
Loading the math board and drawing, please wait…
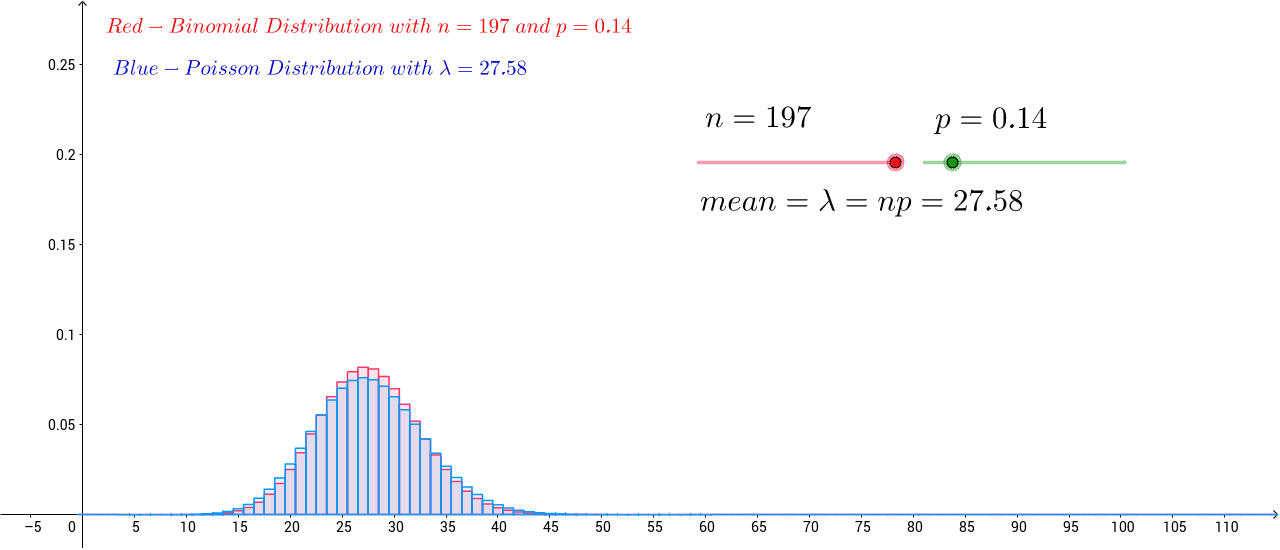
This example demonstrates the graphical phenomenon of how the Poisson distribution approximates the binomial distribution. The core mathematical concepts involved include the binomial distribution, Poisson distribution, and probability & statistics. The construction uses GeoGebra commands/objects: BinomialDist, Poisson, n, p, text1, text1_1, np, np_1, np_2, a, b, np_4, np_3, np_5, text2_1, text2_2, text2_4. It is suitable for high school students and those preparing for math competitions.
GeoGebra Commands & Parameters
BinomialDist(n, p) → aPoisson(n * p) → b
AI Drawing Prompt Reference
Create a graph demonstrating how the Poisson distribution approximates the binomial distribution, featuring a slider to control the parameters of the binomial distribution, and showing the corresponding Poisson distribution curve, with labels for the product of the binomial parameters and the Poisson parameter, and text explaining the relationship between them, suitable for high school students and math competition preparation.
The prompt above was compiled from the original drawing commands and is for reference only.