
Point Coordinates Example
Loading the math board and drawing, please wait…
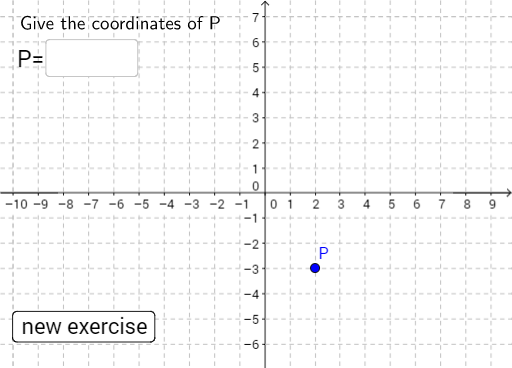
This example demonstrates how to plot point coordinates and display their positions in GeoGebra, focusing on coordinate geometry, vertices of a rhombus, and inequalities. Key GeoGebra commands used include Random for generating random coordinates, Textfield for displaying text, variables a and b for storing coordinate values, Sol and Ans for storing results, empty for clearing objects, and interactive elements like text1, InputBox1, and button1. Suitable for middle school and above students learning coordinate geometry and geometric constructions, or probability statistics.
GeoGebra Commands & Parameters
Random(-5, 5) → aRandom(-4, 4) → bTextfield(empty) → InputBox1
AI Drawing Prompt Reference
Plot a random point on a coordinate plane, with its x-coordinate randomly chosen between -5 and 5, and its y-coordinate randomly chosen between -4 and 4. Place an input box near the point to display or enter the coordinate values. The overall scene should emphasize the coordinate axes, grid lines, and the marked position of the random point, along with a simple display of its coordinates for easy observation of the relationship between the point's location and its numerical values.
The prompt above was compiled from the original drawing commands and is for reference only.