
Plotting Points on the Rational Function y=1/x
Loading the math board and drawing, please wait…
In collections
Grade 12 PreCalculus BC
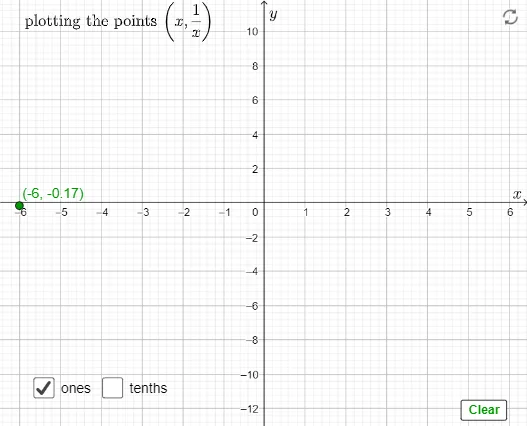
This GeoGebra example dynamically demonstrates the graph of the rational function y=1/x and allows users to plot points on the curve, visually exploring how the function changes with the independent variable. The core mathematical concept is the rational function (inverse proportion), including its domain, range, asymptotes, and the characteristic that function values decrease as x increases. Construction highlights: the Corner command is used to obtain the coordinate range of the graphics view, the If conditional statement controls point visibility and placement, sliders (a, b, incr) adjust parameters, a button (button1) triggers actions, and text objects (text1, text2) display coordinate information. This example is suitable for middle school to high school students learning function graphs and coordinate geometry, and also serves as a classroom demonstration tool for teachers to illustrate the graph of y=1/x and the correspondence between points and coordinates.
GeoGebra Commands & Parameters
Corner(5) → dimsIf(a ≟ 1, 1, 0.1) → incr
AI Drawing Prompt Reference
Create a graph demonstrating the rational function y=1/x, showing the curve and allowing points to be dynamically plotted on it to explore how the function changes with the independent variable. Use sliders to adjust parameters, a button to control point visibility and placement, and text to display coordinates. First determine the coordinate range of the view, then plot the function curve, and finally adjust the position and visibility of points based on the slider values using conditional logic.
The prompt above was compiled from the original drawing commands and is for reference only.