
Plotting Parametric Curves
Loading the math board and drawing, please wait…
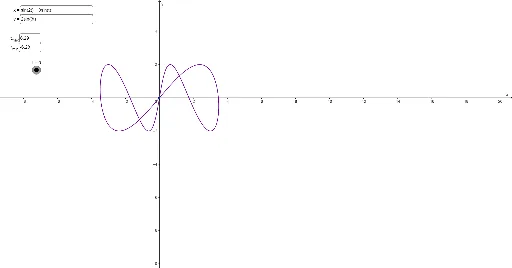
This example demonstrates how to plot curves defined by parametric equations x=f(t), y=g(t) over an interval t_min <= t <= t_max. Key math concepts include parametric equations and coordinate geometry. Construction involves using Textfield for annotations, CurveCartesian for plotting, with parameters m, n, b, input boxes for function definitions f, g, and range a, plus Locus for trajectory visualization. Suitable for high school and above students learning parametric equations applications.
GeoGebra Commands & Parameters
Textfield(m) → inputBox1Textfield(n) → inputBox2Textfield(f) → inputBox3CurveCartesian(f(t), g(t), t, m, b) → aTextfield(g) → inputBox4
AI Drawing Prompt Reference
Draw a parametric curve with domain t from m to b, include text boxes for inputs m and b, and text boxes for function expressions f(t) and g(t), plot the curve using the input function expressions, display the text boxes for f(t) and g(t), and use locus to show the trajectory of the curve.
The prompt above was compiled from the original drawing commands and is for reference only.