
Plotting Fraction and Decimal Positions on a Number Line
Loading the math board and drawing, please wait…
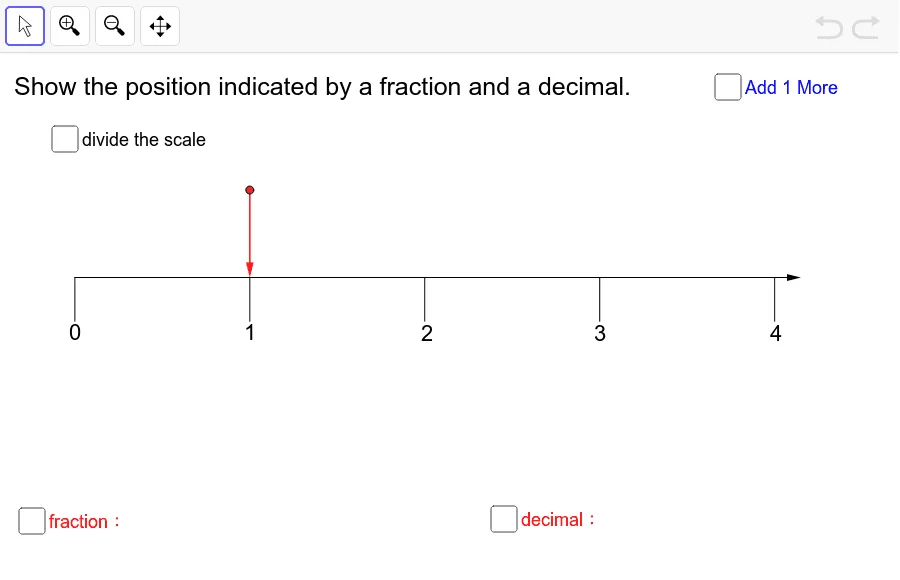
This example demonstrates how to place given fractions and decimals at their correct locations on a number line, using refined tick marks to make their equivalence visually clear. Key math ideas include number-line coordinate representation, the relationship between fractions and decimals via proportional subdivision, and geometric encoding of numeric values by points. Construction-wise, it builds and manages objects with GeoGebra commands such as Point, Segment, Sequence, and Vector, sets up a baseline and reference structure (e.g., objects like initialpixelperunit, L, B, D0, O), and then performs repeated subdivision using a diameter-as-measure unit to generate finer ticks. A series of points corresponding to intermediate positions (e.g., Q, R, S, T, U, V, W, Z and A_1, A2, A3, A4) is created and labeled through annotation objects (e.g., text1, text12–text16) and list containers (e.g., list6–list8). The setup supports interactive presentation (buttons/controls) for classroom exploration. Suitable for middle/high school and early college learners to practice fraction–decimal conversion, number-line reading, and geometry-based number visualization.
GeoGebra Commands & Parameters
Point(yAxis) → BSegment((0, -0.55), (0, -0.8)) → bSequence(Segment[(i, 0), (i, -1 * 0.25)], i, 0, 4) → list6Sequence(Segment[((2 * i - 1) / 2, 0), ((2 * i - 1) / 2, -1 * 0.2)], i, 1, 4) → list7Sequence(Sequence[Segment[(i / 2 + 0.1 * j, 0), (i / 2 + 0.1 * j, -1 * 0.15)], j, 1, 4], i, 0, 7) → list8Sequence(Sequence[Segment[(i / 20 + 0.01 * j, 0), (i / 20 + 0.01 * j, -1 * 0.06)], j, 1, 4], i, 0, 79) → list9Sequence(Segment[((2 * i - 1) / 20, 0), ((2 * i - 1) / 20, -1 * 0.1)], i, 1, 40) → list10Point(Sequence[(i, L / 2), i, 0, 4, 0.01]) → AVector((0, 0), (4.15, 0)) → aVector(A, (x(A), 0)) → uPoint(Sequence[(i, L / 2), i, 0, 4, 0.01]) → A'Vector(A', (x(A'), 0)) → v
AI Drawing Prompt Reference
Draw a number line as a horizontal baseline and construct a refined scale from 0 to 4. First create coarse tick marks, then subdivide each interval repeatedly using a consistent small segment length to generate finer ticks. Place points on the number line at the intermediate equally spaced positions, and label/select positions so that the fractional and decimal locations correspond to the same coordinates on the line. The final figure should clearly show the equivalence between fractions and their decimal forms through the dense, proportional tick marks.
The prompt above was compiled from the original drawing commands and is for reference only.