
Plotting Complex Roots of Parabola
Loading the math board and drawing, please wait…
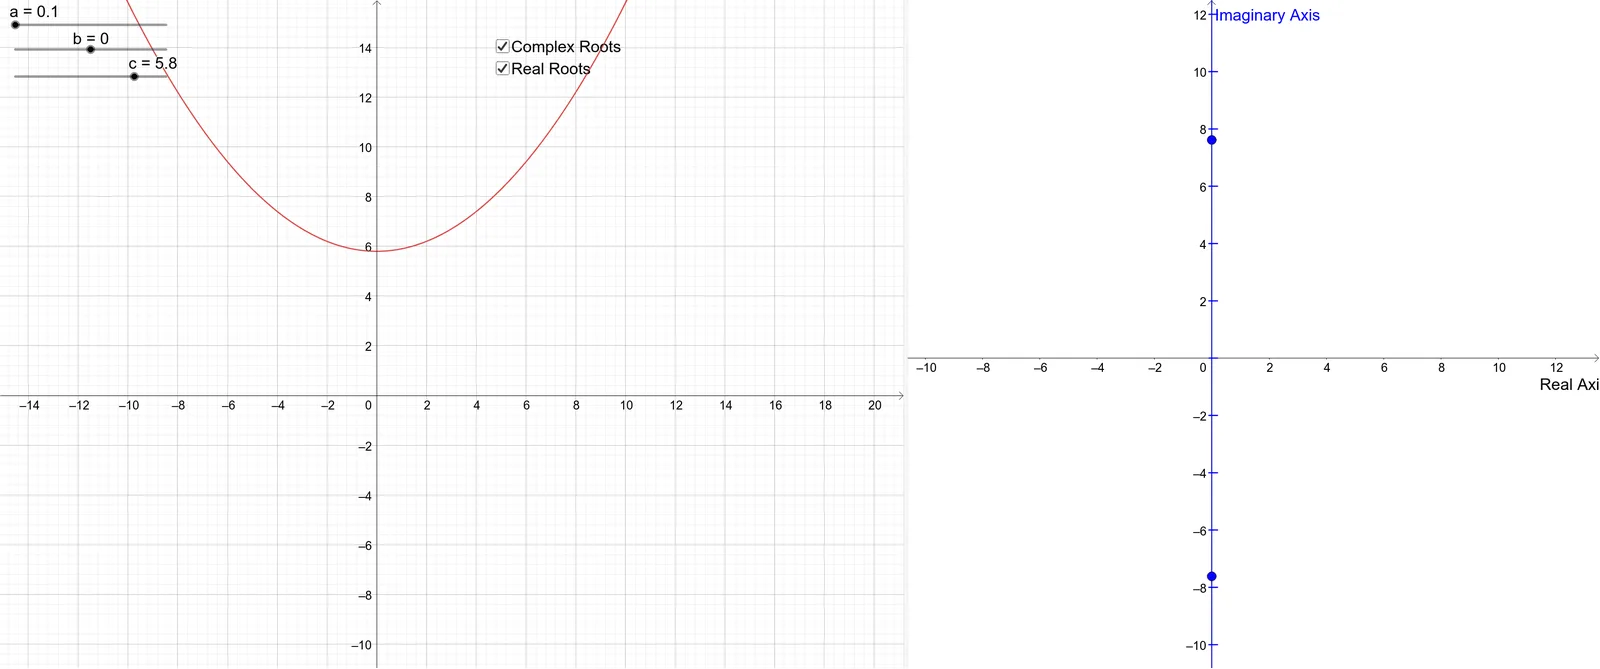
This example demonstrates how to plot the complex roots of a parabola and their positions in the complex plane. Key math concepts include complex numbers, parabola equations, and the calculation of complex roots. Construction highlights involve GeoGebra commands like ComplexRoot (for computing complex roots), Line (for drawing lines), and Sequence (for generating sequences), with objects such as parameters a, b, c, function f, point p, complex number w, auxiliary objects g, h, root points Z_1, Z_2, text labels text1, text2, and coordinate axes yA, YTicks. Suitable for high school and above students to understand the relationship between complex numbers and quadratic equation roots, as well as the application of complex numbers in geometry.
GeoGebra Commands & Parameters
ComplexRoot(f) → p, wLine((0, -10), yAxis) → yASequence(Segment[(-0.1, n), (0.2, n)], n, (floor(y(Corner[1]) / AxisStepY[]) * AxisStepY[]), y(Corner[4]), AxisStepY[]) → YTicks