
Plot Translation in Any Direction
Loading the math board and drawing, please wait…
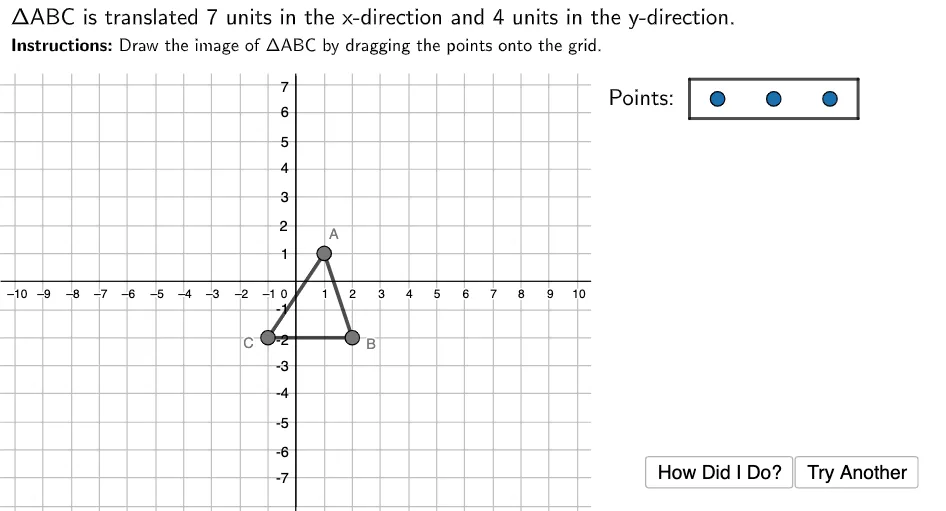
This example demonstrates how to perform translation in any direction. Key mathematical concepts include translation and function graphing. Using GeoGebra commands such as Polygon, Join, Point, Textfield, and Segment, the translated figure can be constructed. Suitable for students at the junior high school level and above to learn about translation and function graphing.
GeoGebra Commands & Parameters
Polygon((10.5, 9), (25, 9), (25, -10), (10.5, -10)) → RightBox, j, k, l, mPolygon((-12, 7.4), (25, 7.4), (25, 15), (-12, 15)) → TopBox, f, g, h, iJoin({Sequence[Sequence[(i, j), i, -10, 10, 1], j, -10, 10, 1], {(15, 6.5), (17, 6.5), (19, 6.5)}}) → GridSpacePoint(GridSpace) → A1Point(GridSpace) → B1Point(GridSpace) → C1Polygon((14, 7.2), (14, 5.8), (20, 5.8), (20, 7.2)) → PointsBox, n, p, q, rPolygon(A, B, C) → ABC, c, a, bPolygon(A1, B1, C1) → ABC1, c1, a1, b1Polygon(Acorr, Bcorr, Ccorr) → ABCcorr, ccorr, acorr, bcorrTextfield(usertext) → InputBox1Segment(Acorr, (x(Acorr), 0)) → Ahelper1Segment(Bcorr, (x(Bcorr), 0)) → Bhelper1Segment(Ccorr, (x(Ccorr), 0)) → Chelper1Segment(Acorr, (0, y(Acorr))) → Ahelper2Segment(Bcorr, (0, y(Bcorr))) → Bhelper2Segment(Ccorr, (0, y(Ccorr))) → Chelper2Segment((0, 7.3), (0, -8)) → yaxis