
Plot Quadratic Functions
Loading the math board and drawing, please wait…
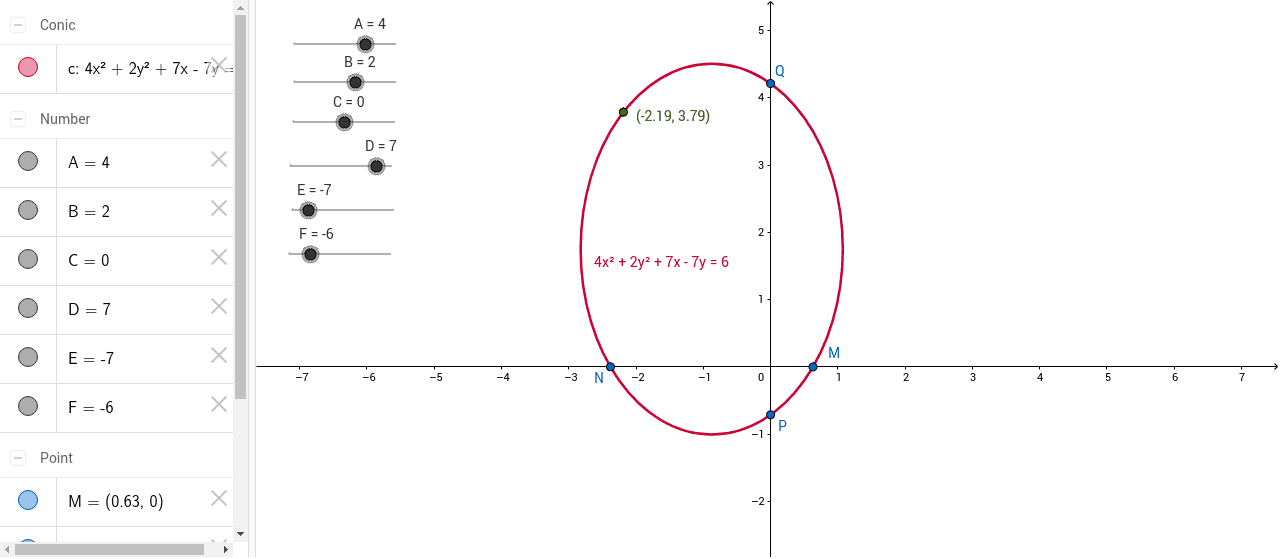
This example demonstrates how to plot quadratic functions. Key mathematical concepts include quadratic functions, vertex, and axis of symmetry. Using GeoGebra commands such as Intersect and Point, the construction of the quadratic function's graph is shown. Suitable for students in middle school and above to learn about quadratic functions.
GeoGebra Commands & Parameters
Intersect(c, xAxis) → M, NIntersect(c, yAxis) → P, QPoint(c) → S
AI Drawing Prompt Reference
Draw the graph of a quadratic function, marking the vertex and axis of symmetry, and showing the points where the graph intersects the x-axis and y-axis. First find the intersection points of the graph with the coordinate axes, then plot the point on the graph, and finally connect these points to form a smooth curve.
The prompt above was compiled from the original drawing commands and is for reference only.