
Plot and Study of Exponential and Logarithm Functions
Loading the math board and drawing, please wait…
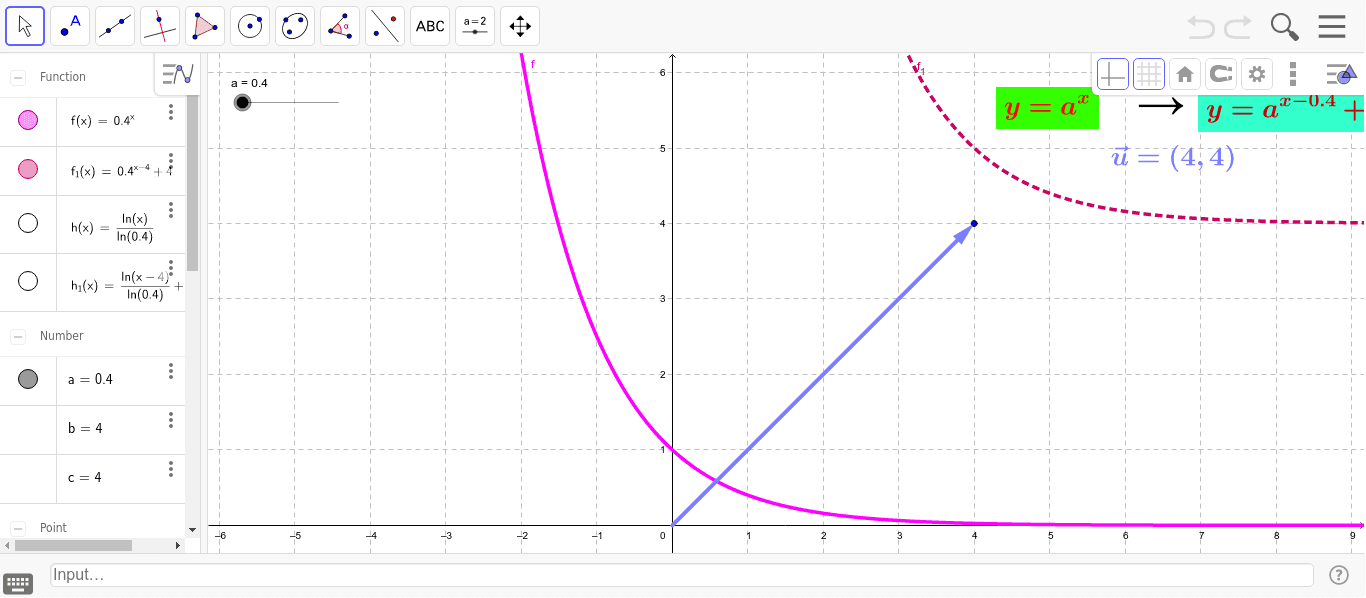
This example demonstrates the graphs and properties of exponential and logarithmic functions. By plotting these functions, students can visually understand the characteristics of exponential growth and logarithmic functions. Commands like Intersect, Vector, and Translate are used to help students master the techniques of graphing functions.
GeoGebra Commands & Parameters
Intersect(xAxis, yAxis) → AVector(A, B) → uTranslate(f, u) → f_1Translate(h, u) → h_1
AI Drawing Prompt Reference
Plot the graphs of an exponential function and a logarithmic function to show their growth and decay characteristics. Start by finding the intersection point of the coordinate axes, then draw a vector from this point. Use this vector to translate the original exponential and logarithmic function graphs to create new ones, allowing observation of the translation effects.
The prompt above was compiled from the original drawing commands and is for reference only.