
One Chart, Four Graphs
Loading the math board and drawing, please wait…
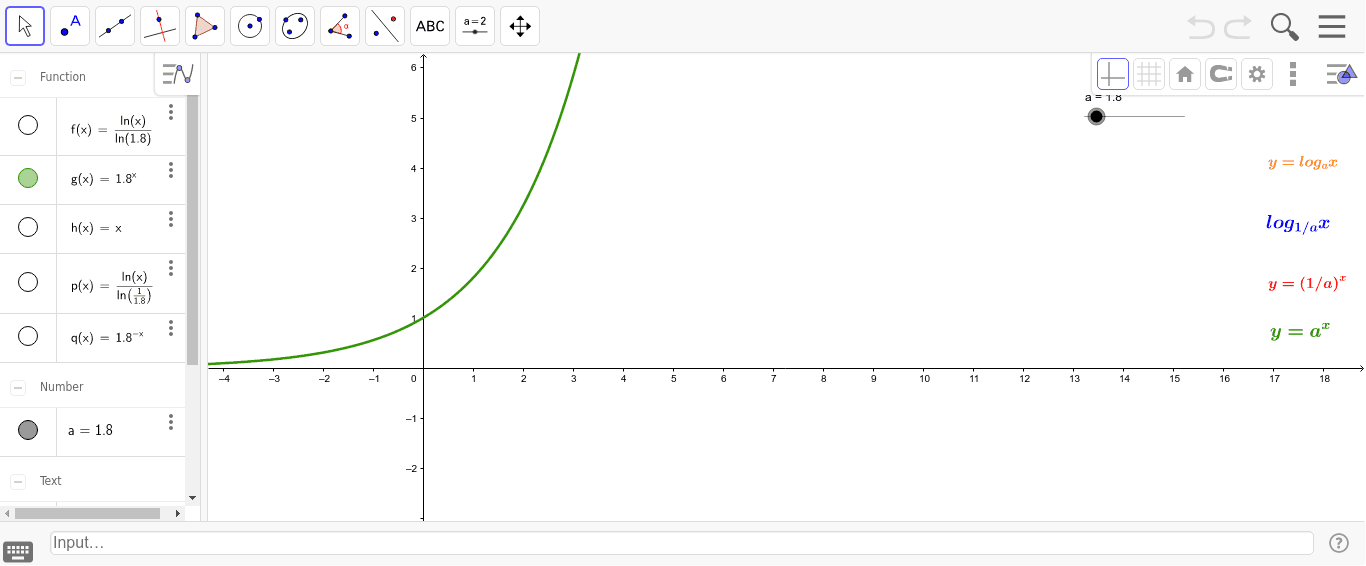
This example demonstrates how logarithmic and exponential functions are related through a single chart displaying four different graphs. It involves core math concepts like logarithmic functions, exponential functions, and graphing techniques. Constructed using GeoGebra commands/objects: a, f, g, h, p, q, texto2, texto1, texto3, texto4. Suitable for high school mathematics students learning about function transformations and relationships between logarithmic and exponential functions.
GeoGebra Commands & Parameters
Numeric a(1.8)f(x) = log(x) / log(a)g(x) = a^(x)h(x) = xp(x) = log(x) / log(1 / a)q(x) = a^(-x)