
Planck's Law of Black-Body Radiation
Loading the math board and drawing, please wait…
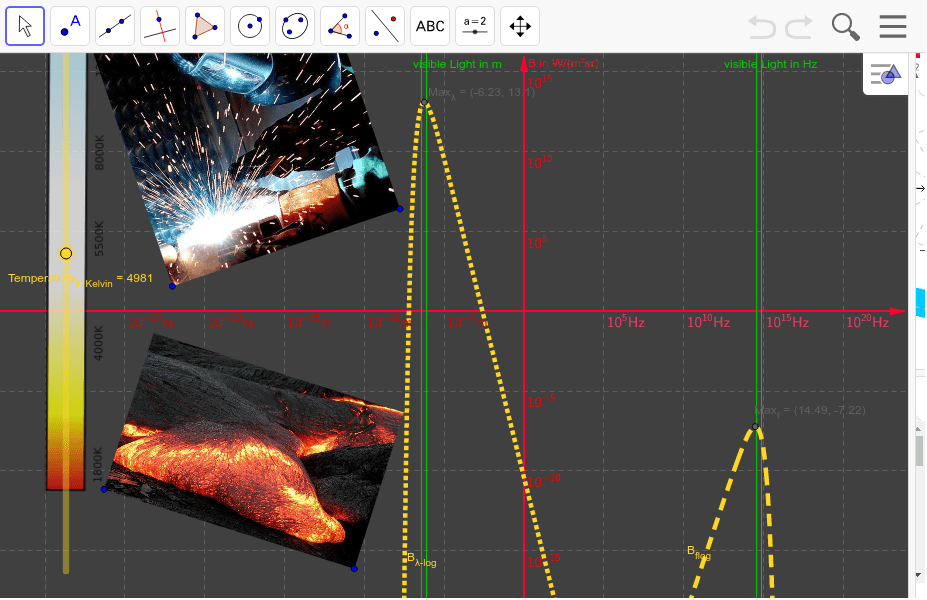
This example illustrates Planck's law, which describes the spectral distribution of an ideal black body at thermal equilibrium. Key mathematical concepts include functions, trigonometry, and limits. Using GeoGebra commands such as PolyLine, Point, Max, and Distance, the relationship between temperature and spectral radiance is constructed. Suitable for high school physics and mathematics education.
GeoGebra Commands & Parameters
PolyLine(A, B, C, D, E, F, G) → Path1Point(Path1, Path1_%) → P_{ColorPath}Max(B_{λ-log}, -10, 10) → Max_λMax(B_{flog}, 0, 20) → Max_fDistance(P_{ColorPath}, (0, 0)) → S_{Color Sat}Circle(P_{ColorPath}, 0.5) → Test_{Circle}OrthogonalLine(V_{vis-λ-max}, xAxis) → sichtbaresSpektrum_2OrthogonalLine(V_{vis-λ-min}, xAxis) → sichtbaresSpektrum_1OrthogonalLine(V_{vis-f-max}, xAxis) → sichtbaresSpektrum_4OrthogonalLine(V_{vis-f-min}, xAxis) → sichtbaresSpektrum_3
AI Drawing Prompt Reference
Draw the spectral radiation distribution of an ideal black body, showing the relationship between temperature and spectral radiation intensity. Start by drawing a polyline, then place a point on the path. Find the maximum value of spectral radiation intensity and draw a circle with a radius of 0.5 centered at this point. Define the range of visible spectrum and draw two vertical lines to indicate the minimum and maximum wavelengths. Finally, draw two more vertical lines to indicate the minimum and maximum frequencies.
The prompt above was compiled from the original drawing commands and is for reference only.