
Piecewise Function Example 2
Loading the math board and drawing, please wait…
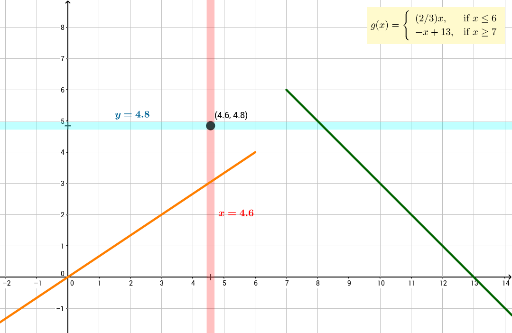
This example helps students graphically identify the domain and range of piecewise functions. Key mathematical concepts include piecewise functions. Construction highlights the use of the Polygon command to draw the piecewise function and the Midpoint command to determine key points. Suitable for high school mathematics education.
GeoGebra Commands & Parameters
Polygon(A, B, C, D) → poly1, a, b, c, dPolygon(E, F, G, H) → poly2, e, j, i, kMidpoint(A, D) → xvalueMidpoint(E, H) → yvalue
AI Drawing Prompt Reference
Draw a piecewise function with two segments. Use the polygon command to draw two segments, polygon ABCD and polygon EFGH. Find the midpoint of A and D, and E and H using the midpoint command, and mark them as xvalue and yvalue respectively.
The prompt above was compiled from the original drawing commands and is for reference only.