
Pie Chart Construction and Statistics
Loading the math board and drawing, please wait…
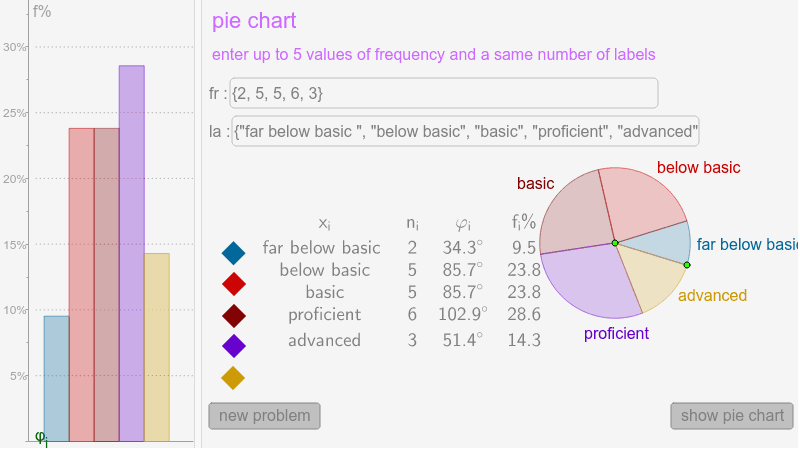
This example demonstrates how to construct a pie chart using GeoGebra, illustrating fundamental statistical data representation methods. Key math concepts include Probability & Statistics, Rational Numbers, data categorization, and visualization. Construction highlights involve commands like Textfield, Sum, Length, Sequence, Append, Element, TableText, and BarChart, enabling data input and pie chart generation. Suitable for middle school and above, ideal for introductory statistics teaching or data visualization practice.
GeoGebra Commands & Parameters
Textfield(Labels) → inputBox2Textfield(Values) → inputBox3Sum(Values) → SLength(Values) → lSequence(360° * Element[Values, k] / S, k, 1, l) → AnglesSequence(Rotate[B, Sum[Take[Angles, 1, k]], A], k, 1, l - 1) → PointsAppend(Append[B, Points], B) → PointsPlusSequence(CircleSector[A, Element[PointsPlus, k], Element[PointsPlus, k + 1]], k, 1, l) → SectorsElement(Sectors, 1) → Sect1Element(Sectors, 2) → Sect2Element(Sectors, 3) → Sect3Element(Sectors, 4) → Sect4Element(Sectors, 5) → Sect5Sequence(100 * Element[Values, k] / S, k, 1, l) → PerLength(Labels) → mSequence(i, i, 2, 2 * l, 2) → list1Append("x_i", Labels) → Labels1Append("n_i", Values) → Values1Append("φ_i", Angles) → Angles1Append("f_i%", Per) → Per1TableText({Labels1, Values1, Angles1, Per1}, "vc") → text3BarChart(0.7, 2.8, {Element[Per, 1]}) → bBarChart(2.8, 4.9, {Element[Per, 2]}) → cBarChart(4.9, 7, {Element[Per, 3]}) → dBarChart(7, 9.1, {Element[Per, 4]}) → eBarChart(9.1, 11.2, {Element[Per, 5]}) → fSequence(Segment[(0, i), (25, i)], i, 5, 100, 5) → list2
AI Drawing Prompt Reference
Create a pie chart to display statistical data, input category labels and corresponding values, calculate the total and percentage for each category, then determine the angle for each sector in the pie chart based on percentages, draw sectors in different colors, and represent each category's percentage with a bar chart beside the pie chart, finally add a table below showing categories, values, angles, and percentages for clarity.
The prompt above was compiled from the original drawing commands and is for reference only.