
PI Approximation
Loading the math board and drawing, please wait…
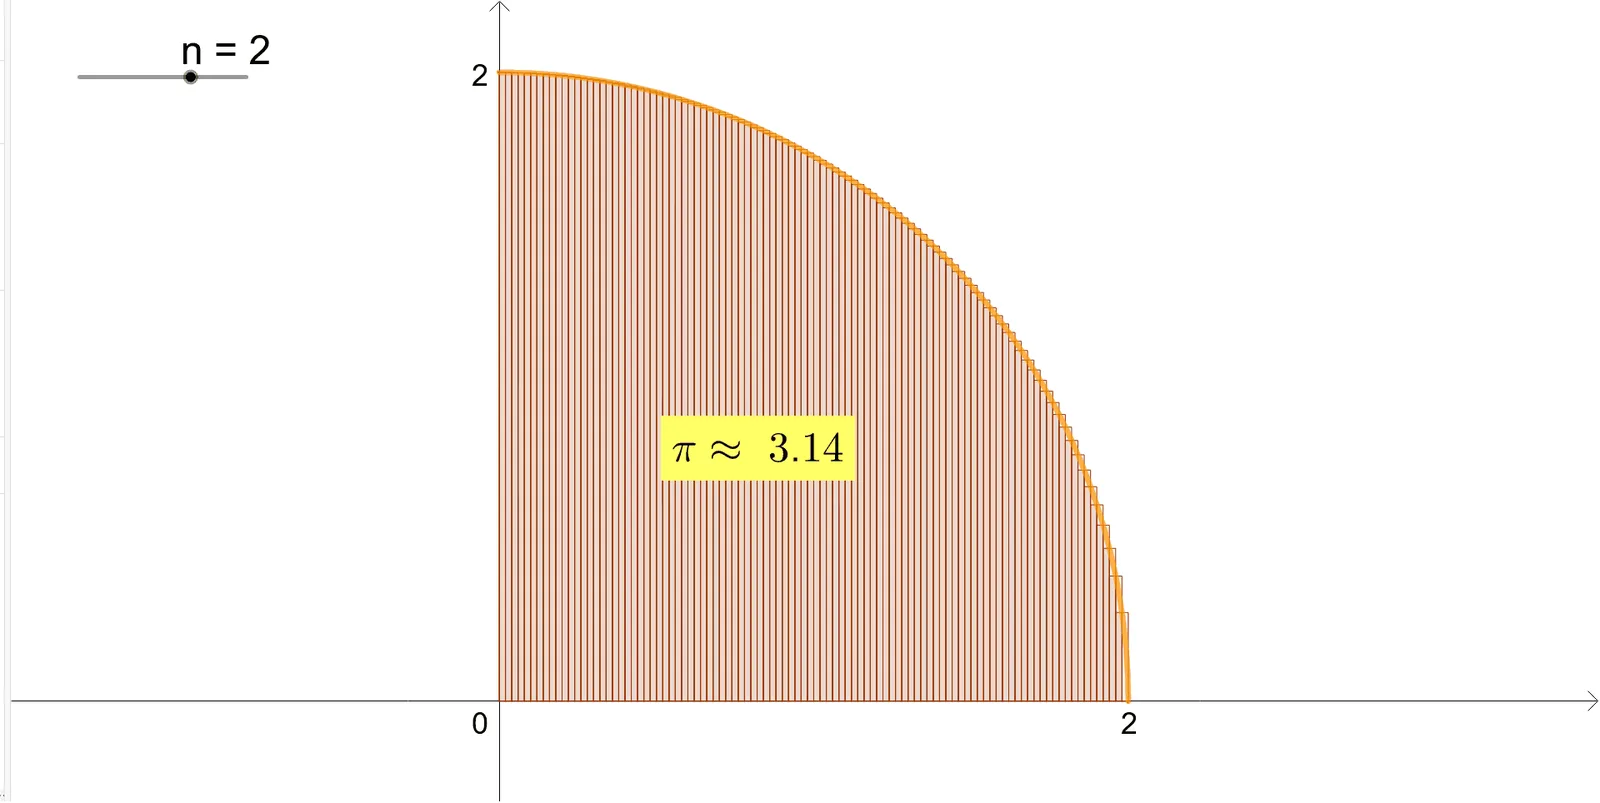
This example demonstrates methods to approximate PI. Core math concepts include integration and limits. Using the LowerSum and UpperSum commands from the construction summary, one can understand how the graph approximates PI through numerical integration. Suitable for high school and above students learning numerical integration in calculus.
GeoGebra Commands & Parameters
LowerSum(f, 0, 2, 10^(n)) → aUpperSum(f, 0, 2, 10^(n)) → b
AI Drawing Prompt Reference
Draw a graph illustrating the approximation of pi through numerical integration. Plot a curve over the interval from 0 to 2, and fill the area under the curve with two sets of rectangular strips: one set using left endpoints of subintervals (lower sum) and another using right endpoints (upper sum). As the number of subdivisions increases (e.g., from 10 to 100 to 1000), the two sets of rectangles converge toward the true area under the curve, which relates to pi. The graph should clearly show the curve, both sets of rectangles, and their convergence as the partition becomes finer.
The prompt above was compiled from the original drawing commands and is for reference only.