
Phantom Graph of f(x)=sinh(x)
Loading the math board and drawing, please wait…
In collections
Phantom Graphs
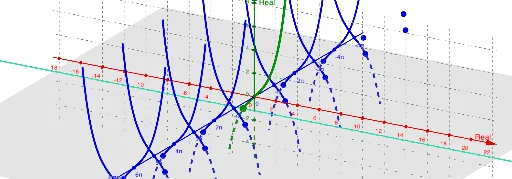
This example demonstrates the phantom graph of the hyperbolic sine function f(x)=sinh(x). Key mathematical concepts include hyperbolic functions. Construction highlights the use of GeoGebra commands Plane and Sequence to plot the function. Suitable for high school and above students to study the graph and properties of hyperbolic functions.
GeoGebra Commands & Parameters
Plane((0, c, 0), (1, c, 1), (-1, c, 4)) → aSequence(CurveCartesian[u, ((-1)^(n) * sinh(u)), (n * π), u, -20, 20], n, -7, 7) → CurvesSequence((asinh(c), c, (n * π)), n, -8, 8, 2) → Pts1Sequence(((-asinh(c)), c, (n * π)), n, -7, 7, 2) → Pts2
AI Drawing Prompt Reference
Draw the phantom graph of the hyperbolic sine function, showing its periodic variations with dashed lines at equal intervals, and mark key points on the coordinate plane to contrast with the actual function graph, aiding in understanding the properties of sinh(x).
The prompt above was compiled from the original drawing commands and is for reference only.