
Percentages: Tax and Tip
Loading the math board and drawing, please wait…
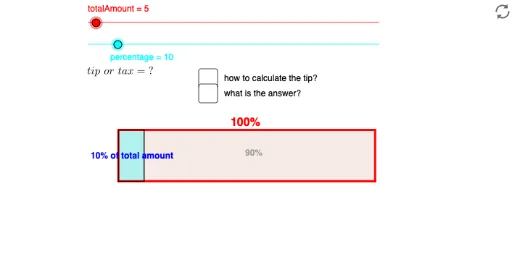
This GeoGebra example demonstrates how percentages are applied to real-life scenarios involving tax and tip calculations. It visually combines geometric constructions with algebraic variables to show the relationship between base amounts, percentage rates, and resulting totals. Core math concepts include percentage operations, proportional reasoning, linear equations, and algebraic evaluation. The construction uses commands such as Point, Segment, OrthogonalLine, Circle, Intersect, Polygon, and Midpoint, along with objects like totalAmount, percentage, and tip, allowing dynamic adjustment via sliders or input fields. Suitable for middle school mathematics lessons on percentages and proportions, as well as high school review or practical math applications, this interactive model helps learners grasp how percentage changes affect monetary amounts through an engaging visual and algebraic interface.
GeoGebra Commands & Parameters
Point(Circle[A, 10]) → BSegment(A, B) → aOrthogonalLine(B, a) → bCircle(A, 2) → cOrthogonalLine(A, a) → dIntersect(c, d) → D_2, DOrthogonalLine(D, d) → eIntersect(b, e) → EPolygon(A, B, E, D) → poly1, a_1, b_1, e_1, d_1Segment(((0.1 * percentage), x(A)), Point[Circle[((0.1 * percentage), y(A)), 2]]) → f_1Segment(((0.1 * percentage) + x(A), y(A)), ((0.1 * percentage) + x(A), y(D))) → fIntersect(f, e_1) → FIntersect(f, a_1) → GMidpoint(A, F) → CMidpoint(G, E) → HMidpoint(D, E) → IPolygon(A, G, F, D) → poly2, a_2, g, f_2, d_2
AI Drawing Prompt Reference
Draw a dynamic diagram for percentage applications: start with a circle, pick a point on it, connect the center to that point as a radius, draw a perpendicular line through that point to the radius, and another perpendicular through the center to the radius, intersecting the circle at two points, then connect these four points to form a rectangle. Inside the rectangle, based on a percentage value (controlled by a slider), shift horizontally from the center, draw two vertical segments that intersect the rectangle's sides, creating two intersection points, and connect these to form a smaller rectangle. Finally, mark several midpoints to illustrate tax and tip calculations.
The prompt above was compiled from the original drawing commands and is for reference only.